

Release Date :
Reference Number :
2024SR-023
Table A. Year-on-Year Inflation Rates: Philippines, MIMAROPA,
and Puerto Princesa City
All Items, In Percent
(2018=100)
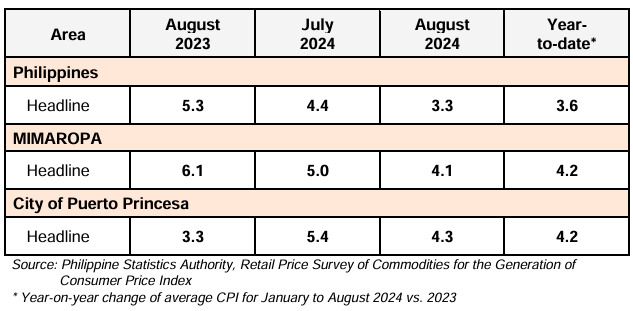
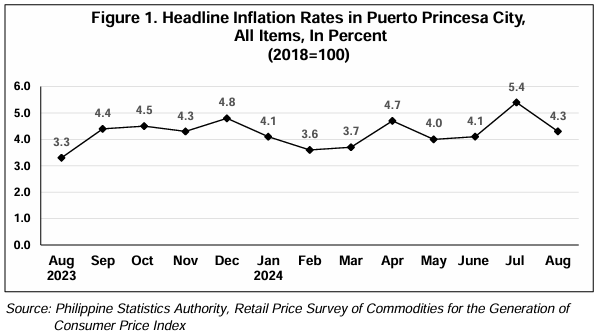
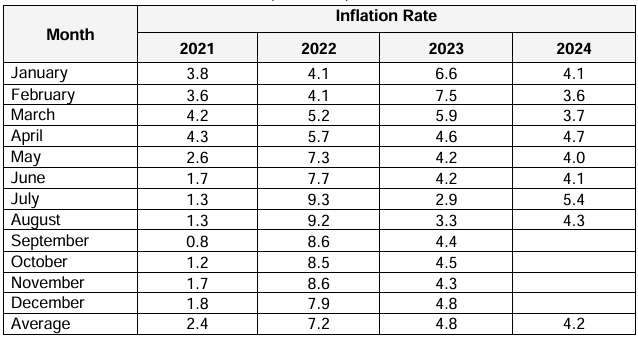
The headline inflation in the City of Puerto Princesa decreased to 4.3 percent in August 2024, from 5.4 percent in the previous month. In August 2023, inflation rate is lower at 3.3 percent. (Table A and Figure 1)
The downtrend in the overall inflation in the province was primarily influenced by the lower index for food and non-alcoholic beverages at 5.1 percent from 6.8 percent in July 2024 and housing, water, electricity, gas and other fuels at 9.8 percent in August 2024 from 10.0 percent in the previous month. Also contributing to the downtrend was transport with an annual drop of 5.1 percent during the month from 0.7 percent annual decline in July 2024.
Table B. Year-on-Year Inflation Rates in Puerto Princesa City,
All Items, In Percent
(2018=100)
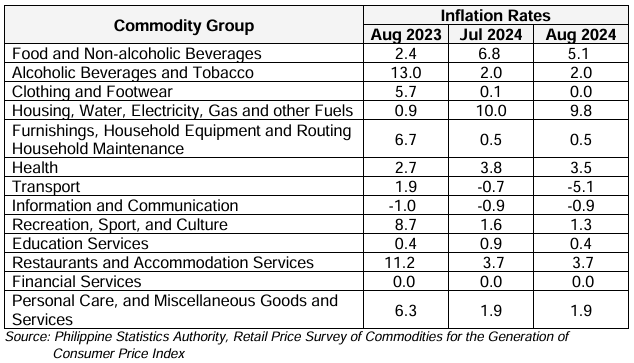
In addition, lower inflation rates were also observed in the following indices:
a. Clothing and Footwear, 0.0 percent from 0.1 percent;
b. Health, 3.5 percent from 3.8 percent;
c. Recreation Sport and Culture, 1.3 percent from 1.6 percent; and
d. Education Services at 0.4 percent from 0.9 percent.
Meanwhile, the other six commodity groups retained their previous month’s inflation rates.
Table C. Year-on-Year Inflation Rates in Puerto Princesa City,
By Food Group In Percent
(2018=100)
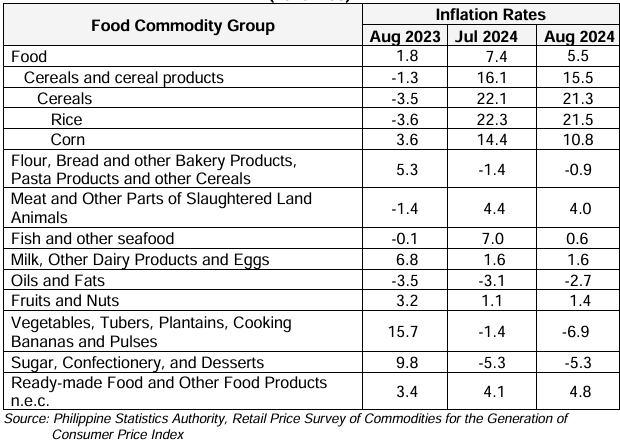
Food index in Puerto Princesa City for August 2024 decreased to 5.5 percent inflation rate, from 7.4 percent in the previous month. In August 2023, the food index was lower, at 1.8 percent inflation rate. (Table C)
The downtrend of the food inflation for the month was brought about by the slower inflation rate of rice with 21.5 percent in August 2024 from 22.3 percent in the previous month. This was followed by meat and other parts of slaughtered land animals at 4.0 percent from 4.4 percent, fish and other seafood, 0.6 percent from 7.0 percent, and vegetables, tubers, plantains, cooking bananas and pulses, with a year-on-year decline of 6.9 percent from an annual decline of 1.4 percent in the previous month.
On the contrary, higher inflation rates were observed in the following food groups:
a. Flour, Bread and other Bakery Products, Pasta Products and other Cereals, -0.9 percent from -1.4 percent;
b. Oils and Fats, -2.7 percent inflation rate from -3.1 percent;
c. Fruits and Nuts, 1.4 percent from 1.1 percent; and
d. Ready-made Food, and Other Food Products n.e.c., 4.8 percent from 4.1 percent.
The two other commodity groups such as flour, bread and other bakery products, pasta products, and other cereals and sugar, confectionery and desserts retained their previous month’s inflation rate of -0.9 percent and -5.3 percent, respectively.
Table D. Year-on-Year Inflation Rates in Puerto Princesa City,
All Items, In Percent
January 2021 – August 2024
(2018=100)
(SGD) DONNA MARIE D. MOBE
(Supervising Statistical Specialist)
Officer-in-Charge
| Attachment | Size |
|---|---|
|
|
605.13 KB |