

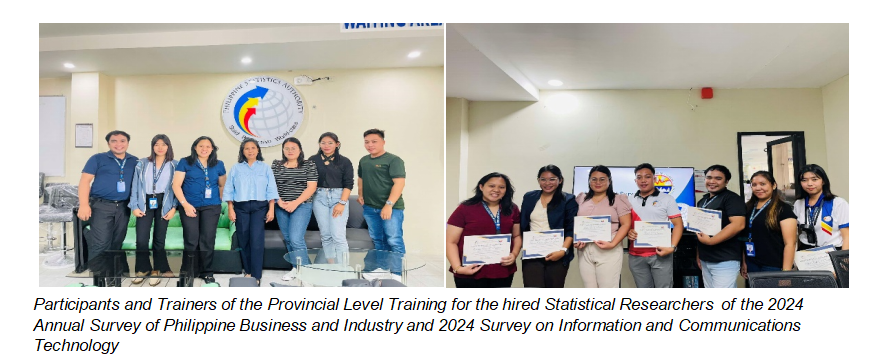
02 May 2025, Mamburao, Occidental Mindoro. The Philippine Statistics Authority (PSA) conducts two major economic surveys - the 2024 Annual Survey of Philippine Business and Industry (ASPBI) and the 2024 Survey on Information and Communication Technology (SICT) — starting April 21, 2025.
The ASPBI generates essential statistics for economic planning and analysis. Specifically, this survey is designed to collect and generate information on the levels, structure, performance and trends of economic activities in the country.
On the other hand, the 2024 SICT will collect information on the availability, distribution, and access/utilization of ICT among establishments in the country and generate core ICT indicators important for measuring the progress in information and communication technology.
As mandated by Republic Act No. 10625, also known as the Philippine Statistical Act of 2013, these surveys form part of PSA’s core data-gathering responsibilities for national economic planning and analysis.
The data collection of 2024 ASPBI will run from April 21 until July 31, 2025, while the SICT will continue through August 15, 2025, which covers key establishments across Occidental Mindoro.
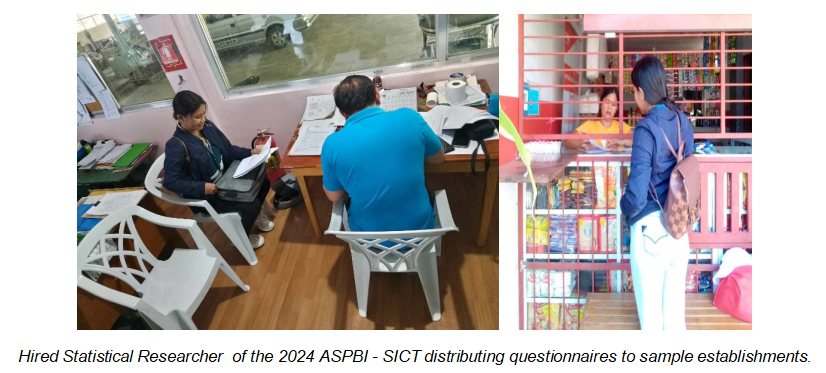
For 2024 ASPBI, there will be 137 sample establishments in Occidental Mindoro, across multiple sectors such as agriculture, manufacturing, utilities, construction, trade, finance, and services. Meanwhile, the SICT will collect ICT-related data from 103 sample key establishments, particularly those involved in digital and technology-driven industries.
The data reference period for both surveys is calendar year 2024, except for employment figures, which will refer specifically to November 2024. Furthermore, the collected data will only be published as aggregate statistics and summary tables, ensuring the anonymity and privacy of all participating enterprises.
With this, PSA Occidental Mindoro strongly encourages all sample establishments to participate actively in the survey by providing accurate, truthful and complete information, necessary for the generation of reliable data towards a data-driven and informed policy and investment decisions.
For more information about the survey, visit the PSA Occidental Mindoro Facebook page or contact the Philippine Statistics Authority – Occidental Mindoro through our email address occidentalmindoro@psa.gov.ph.
(SGD) MARIBEL L. BERNARDO, PhD
Chief Statistical Specialist