Marinduque recorded about 59,263 occupied housing units
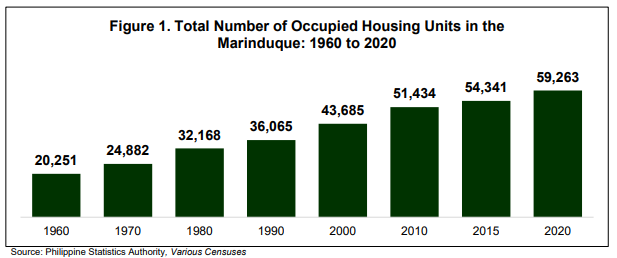
According to the results of the 2020 Census of Population and Housing (2020 CPH), a total of 59,263 housing units were occupied by households/household population as of May 1, 2020, in Marinduque. In 2015, there were 54,341 recorded occupied housing units, while in 2010, there were 51,434 occupied housing units.
Between 2020 and 2015, the number of occupied housing units increased by 4,922, or 9.1 percent.
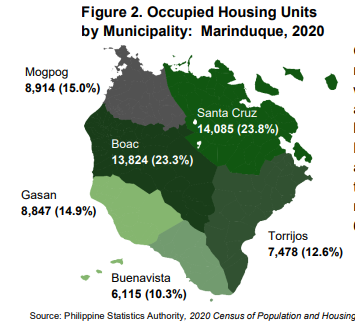
Of the total number of occupied housing units, the majority were from the municipality of Santa Cruz, with 14,085 occupied housing units, comprising about 23.8 percent of the total number of occupied housing units in the province. This was followed by Boac with 13,824 occupied housing units, accounting for 23.3 percent. On the other hand, the Municipality of Buenavista recorded the lowest number of occupied housing units with only 6,115 units, representing 10.3 percent.
With a total of 60,547 households recorded in Marinduque in 2020, this translates to a ratio of 102 households for every 100 occupied housing units. On the other hand, there were approximately 4.03 persons per occupied housing unit recorded in 2020.
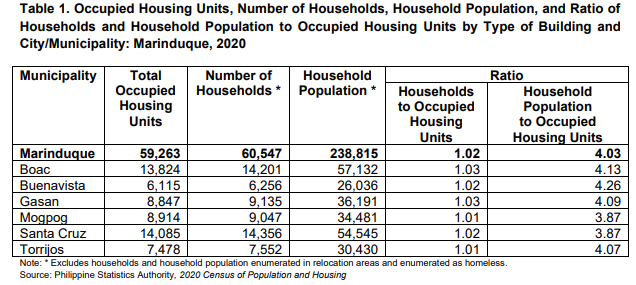
Across the province, Boac and Gasan recorded the highest ratio of 103 households for every 100 occupied housing units. These two municipalities exceeded the provincial ratio of 102 households per 100 occupied housing units. Followed by Buenavista and Santa Cruz with 102 households for every 100 occupied housing units. And the lowest ratios were in Mogpog and Torrijos, with 101 households for every 100 occupied housing units.
Majority of the occupied housing units were single houses
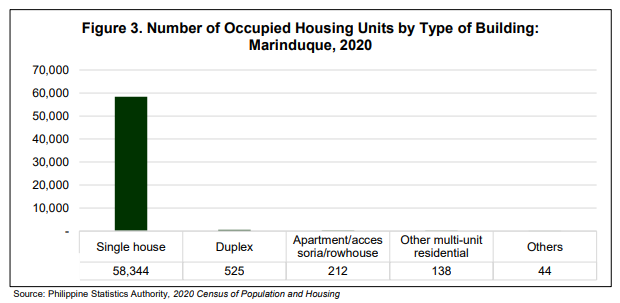
Of the total number of occupied housing units in Marinduque, 58,344, or 98.4 percent, were single houses. This was followed by occupied housing units in duplexes with 525 (0.9%), in apartments/accessorias/rowhouses with 212 (0.4%), and in other multi-unit residential buildings with 138 (0.2%). Meanwhile, 44 (0.1%) were occupied housing units in commercial/industrial/agricultural, institutional living quarters, and other types of buildings.
Majority of the occupied housing units have strong materials of the outer walls, roof and floor
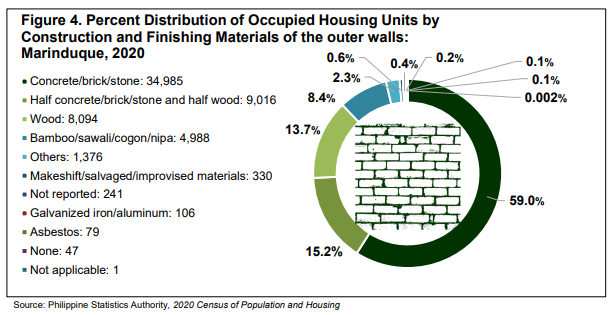
In 2020, 59.0 percent of the occupied housing units in the province had outer walls made of concrete/brick/stone, followed by outer walls of occupied housing units made of half concrete/brick/stone and half wood, accounting for 15.2 percent. Additionally, 13.7 percent had outer walls made of wood.
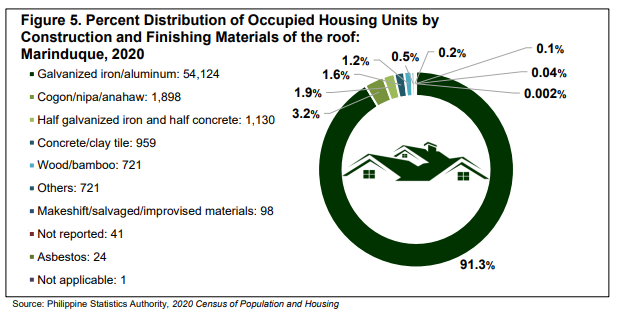
The majority (91.3%) of the occupied housing units in 2020 had roofs made of galvanized iron/aluminum. This was followed by the proportion of occupied units with roofs made of cogon/nipa/anahaw, and half galvanized iron and half concrete, with 3.2 percent and 1.9 percent, respectively.
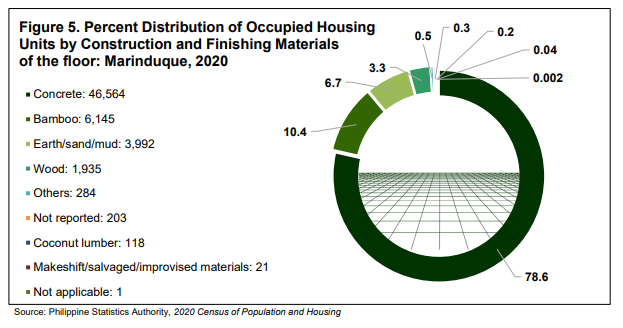
Of the occupied housing units, 78.6 percent have concrete construction materials for the floor. Other construction materials of the housing units include bamboo (10.4%), earth/sand/mud (6.7%), wood (3.3%), coconut lumber (0.2%), makeshift/salvaged/improvised materials (0.04%), and others (0.5%).
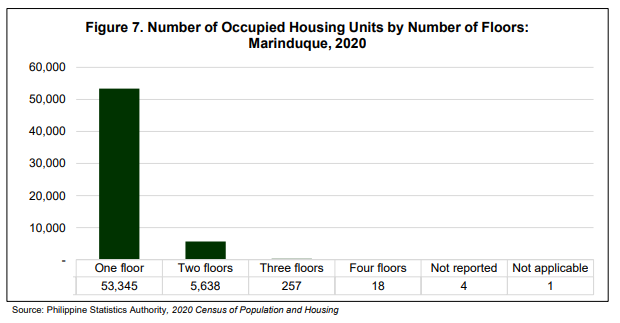
Majority of buildings in Marinduque are one-storey structures
Majority, or about 53,345 occupied housing units (90.0%), were one-storey buildings only. This was followed by housing units with two-storey buildings, with 5,638 (9.5%), and housing units with three-storey buildings, with 257 (0.4%). The remaining 18 (0.03%) are housing units in buildings with more than three storeys.
Most of the housing units in Marinduque only required minor repairs or did not need repairs at all
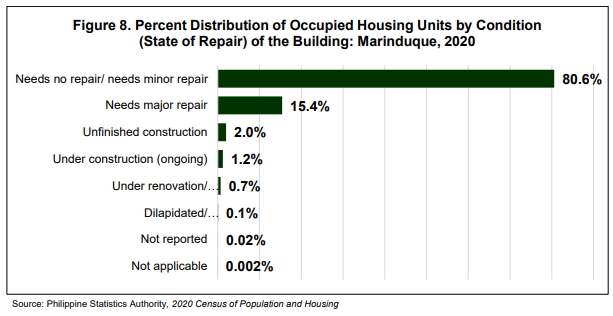
In 2020, 80.6 percent (47,752 housing units) of the occupied housing units only needed minor repair or need not be repaired at all.
Meanwhile, the proportion of occupied housing units needing major repair comprised 15.4 percent (9,134 housing units). Moreover, the rest of the occupied housing units were categorized as unfinished construction (2.0% or 1,185 housing units), under construction (1.2% or 728 housing units), under renovation/being repaired (0.7% or 397 housing units), and, dilapidated/condemned (0.1% or 54 housing units).
Almost 36.7 percent of the housing units in Marinduque were built between 2011 and 2020
About 36.7 percent of the occupied housing units in Marinduque were built 10 years prior to the 2020 Census of Population and Housing (CPH), that is, in the period 2011 to 2020, while 19.0 percent were built during the period 2001 to 2010.
In addition, 38.8 percent were built more than 20 years prior to the 2020 CPH, with 17.3 percent built during the period 1991 to 2000, 9.9 percent during the period 1981 to 1990, and 11.6 percent in 1980 or earlier.
Figure 9. Number and percent distribution of the Occupied Housing Units by Year Built: Marinduque, 2020

Almost half of the housing units had a floor area of less than 20 sq. m.
In 2020, occupied housing units with a floor area of less than 20 sq. m. (less than 209 sq. ft.) accounted for 47.7 percent (28,280 housing units) of the total occupied housing units. This was followed by housing units with a floor area of about 20-29 sq. m. (210-317 sq. ft.) comprising 16.2 percent (9,625 housing units), housing units with a floor area of 30-49 sq. m. (318-532 sq. ft.) comprising 12.9 percent (7,628 housing units), and housing units with a floor area of 50-69 sq. m. (533-748 sq. ft.) comprising 7.9 percent (4,706 housing units).
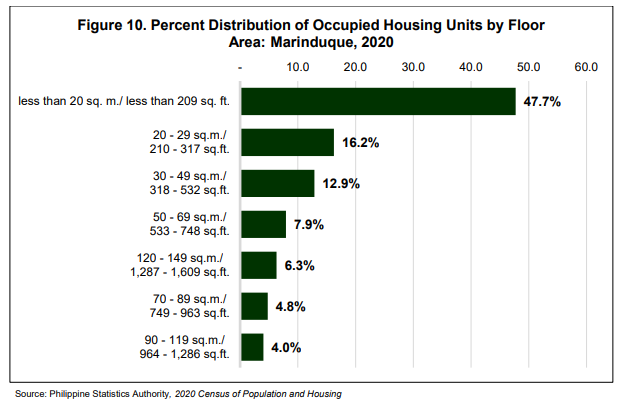
Meanwhile, occupied housing units with a floor area of 120 sq. m. (1,287 sq. ft.) or larger accounted for 6.3 percent (3,738 housing units). Those with a floor area ranging from 70-89 sq. m. (749-963 sq. ft.) accounted for 4.8 percent (2,838 housing units), while those with a floor area of about 90-119 sq. m. (964-1,286 sq. ft.) accounted for 4.0 percent(2,391 housing units).
More than half of the households own the house and lot of the housing units
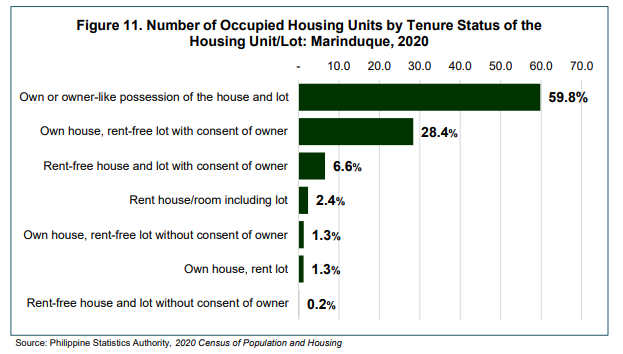
Of the 60,547 households, 59.8 percent (36,205 housing units) owned or had owner-like possession of the house and lot they occupied. Moreover, 28.4 percent (17,185 housing units) of the households owned the house while occupying a rent-free lot with the consent of the owner. Furthermore, 6.6 percent (3,984 housing units) rented the house/room including the lot that they occupied, and 2.4 percent (1,453 housing units) had rent-free house and lot with the consent of the owner.
Technical Notes:
The statistics presented in this Special Release were based on the information provided by the household respondents or any responsible member who provided answers to the questions and gave information about the characteristics of the housing units. For the following data items, observation of the building/housing unit by the enumerator was allowed during the data collection of the 2020 CPH:
1. Type of Building;
2. Number of Floors of the Building;
3. Construction Materials of the Roof;
4. Construction Materials of the Outer Walls; and
5. State of Repair of the Building.
(SGD)GEMMA N. OPIS
Chief Statistical Specialist
PSA PSO Marinduque

