

Release Date :
Reference Number :
P51-SR2023-01
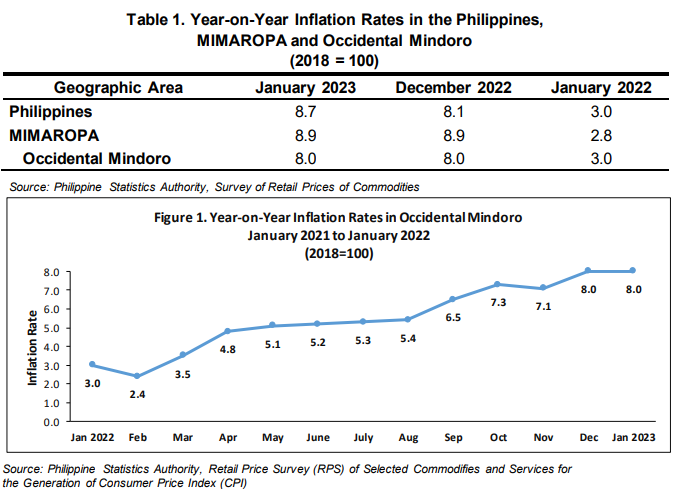
Inflation in Occidental Mindoro remained unchanged at 8.0 percent in January 2023, just as it was in December 2022 and 3.0 percent in January of the previous year. Nine goods and services showed stability in their inflation rate between December 2022 and January 2023 Similarly, inflation in MIMAROPA remained unchanged at 8.0 percent in January 2023 and December 2022. However, in January 2022, the inflation in the region was 2.8 percent
Inflation Rate by Commodity Group
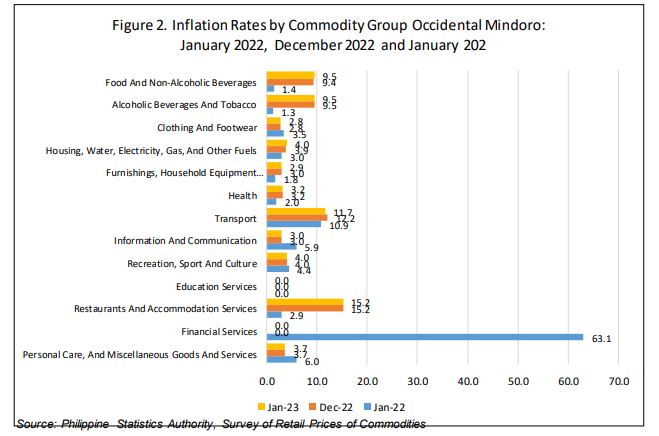
• The monthly increase in the inflation rate was higher for the following commodity groups compared to the previous month:
➢ Food and Non-Alcoholic Beverages, 9.5%
➢ Housing, Water, Electricity, Gas and Other Fuels, 4.0%
• Lower annual gains were observed in the inflation rates of the following commodity groups compared to the previous month:
➢ Furnishings, Household Equipment and Routine Household Maintenance, 2.9%
➢ Transport, 11.7%
• Meanwhile, the indices of the following goods and services remained unchanged in terms of inflation rate in January 2023 compared to December 2022:
➢ Alcoholic beverages and tobacco (Equal at 9.5%)
➢ Clothing and footwear (Equal at 2.8%)
➢ Health (Equal at 3.2%)
➢ Information and communication (Equal at 3.0%)
➢ Recreation, sport, and culture (Equal at 4.0%)
➢ Education services (Equal at 0%)
➢ Restaurants and accommodation services (Equal at 15.2%)
➢ Financial services (Equal at 0%)
➢ Personal care, and miscellaneous goods and services (Equal at 3.7%)
Inflation Rate by Food Group
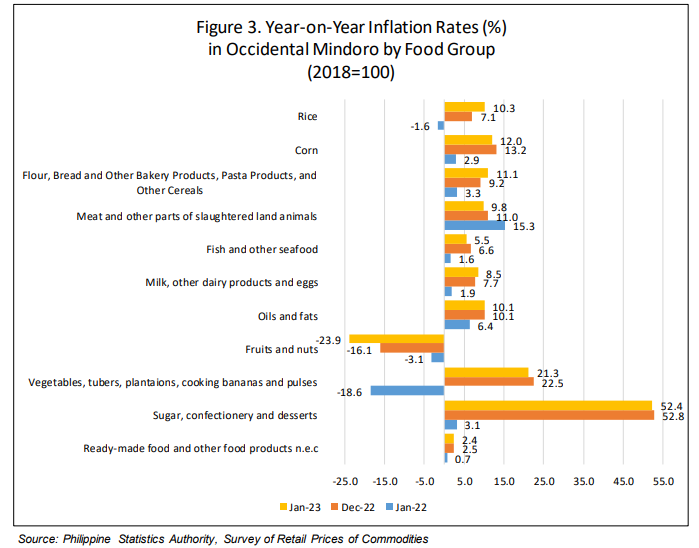
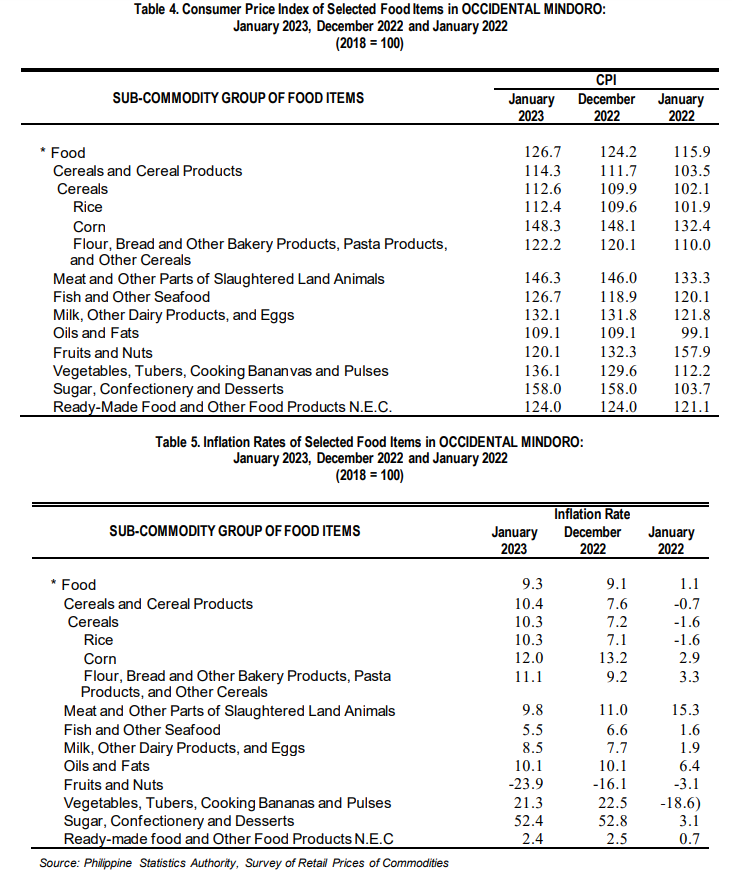
Inflation for food index in the province increased to 9.3 in January 2023 from 9.1 last December 2022. In January 2022, it was registered at 1.1 percent.
The annual indices of commodities with top contributions to the inflation rate of the province are the following:
Rice 10.3%, (85.0 percent share to inflation trend)
➢ Flour, Bread, and Other Bakery Products, Pasta Products, And Other Cereals, 11.1%, (11.0 percent share to inflation trend)
➢ Milk, other dairy products, and eggs, 8.5%, (4.0 percent share to inflation trend)
Additionally, Corn, Meat and other parts of slaughtered land animals, Fish and other seafood, Fruits and nuts, Vegetables, tubers, plantains, cooking bananas, and pulses, Sugar, confectionery and desserts, and Ready-made food and other food products n.e.c. showed a downward trend. However, the price of Oils and fats remained unchanged, resulting in the overall inflation for the food group continuing its upward trend to 9.3 percent.
Purchasing Power of the Peso (PPP)
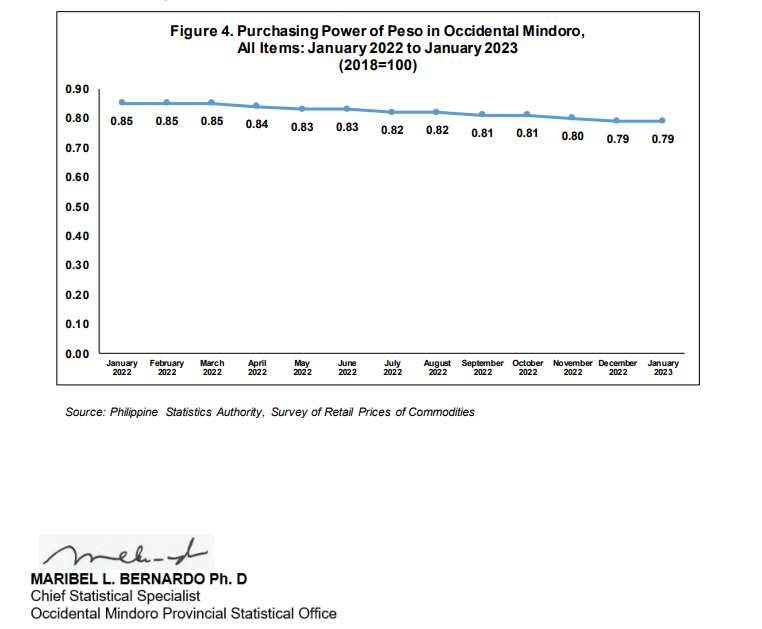
• The purchasing power of peso in Occidental Mindoro in January 2023 remained at Php 0.79 peso. This figure means that a peso in 2018 is only worth 79 centavos in January 2023, while the PPP was registered at 0.85 in January 2022. As a result, the amount of goods that can be presently purchased by consumers were fewer compared to when the PPP was higher. Furthermore, despite having an inverse relationship, the Purchasing Power of Peso remained unchanged due to the stability in the inflation rate in December 2022 and January 2023.

Technical Notes
What is Consumer Price Index (CPI)?
The CPI is an indicator of the change in the average retail prices of a fixed basket of goods and services commonly purchased by households relative to a base year.
What are the uses of CPI?
The CPI is most widely used in the calculation of the inflation rate and purchasing power of the peso. It is a major statistical series used for economic analysis and as a monitoring indicator of government economic policy.
How is the CPI computed?
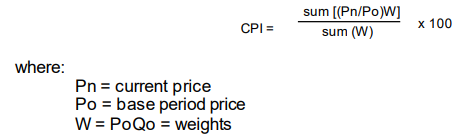
The CPI is computed using the weighted arithmetic mean of price relatives, a variant of the Laspeyres formula with fixed base year period weights. In computing the CPI, the formula is
Base Period - a reference date or simply a convenient benchmark to which a continuous series of index numbers can be related. The base period is year and the index is taken as equal to 100. The present series uses 2012 as the base year.
Market Basket - selected sample of the varieties of goods purchased by consumption and services availed by households in the country to represent the composite price behavior of all goods and services purchased by consumers.
Weighting System - a desirable system that considers the relevance of the components of the index. For the CPI, the weighting pattern uses the expenditures on various consumer items purchased by households as a proportion to total expenditure.
What is Inflation Rate?
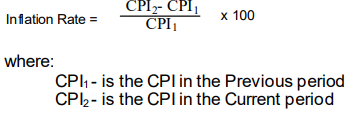
Inflation rate is the annual rate of change or the year-on-year change of the CPI expressed in percent. That is,
What is Purchasing Power of the Peso (PPP)?
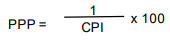
The PPP is a measure of the real value of the peso in a give period relative to a chosen reference period. It is computed as the reciprocal of the CPI and multiplying the result by 100. That is,
| Attachment | Size |
|---|---|
|
|
454.18 KB |