

Release Date :
Reference Number :
2024 - 012

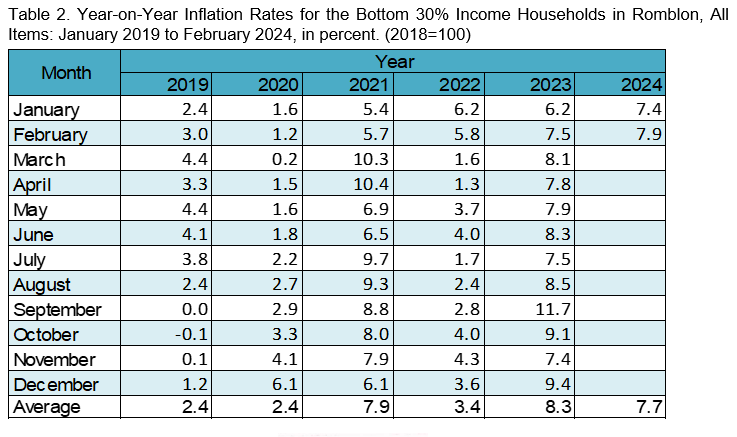
Romblon’s inflation rate for the bottom 30% income households increased to 7.9 percent in February 2024 from 7.4 percent in January 2024. In February 2023, the inflation rate was posted at 7.5 percent (Table 1).
The main driver to the inflation trend of this income group in February 2024 was primarily brought by the higher year-on-year growth rate in the heavily weighted Food and Non-alcoholic Beverages with 9.7 percent from 7.4 percent in the previous month.
In contrast, lower annual growth rates were noted in the indices of Restaurants and Accommodation Services with 13.2 percent in February 2024 from 18.5 percent in the previous month, and Furnishings, Household Equipment and Routine Household Maintenance with 14.2 percent during the month from 18.2 percent in January 2024.
Main Contributor to the Overall Inflation
The following commodity groups were the top 3 contributors to the February 2024 overall inflation for the bottom 30% income households:
Food and Non-alcoholic Beverages, 72.3 percent share or 5.71 percentage points)
Restaurant and Accommodation Services, 10.0 percent share or 0.79 percentage points
Personal Care, Miscellaneous Goods and Services, 4.8 percent or 0.38 percentage points
Food Inflation
Food inflation for the bottom 30% income households at the provincial level moved at a faster pace of 9.9 percent in February 2024 from 7.5 percent in the previous month. In February 2023, its annual increase was observed at 8.6 percent.
Main Drivers to Upward Trend of Food Inflation
The uptrend in food inflation was mainly due to faster annual increase of cereals and cereal products with 21.0 percent during the month from 11.5 percent in January 2024. In addition, sugar, confectionery and desert products, and fish and other seafood also showed faster annual increase with 4.5 percent and 4.1 percent, respectively.
In contrast, faster annual decreases were recorded in the indices of the following:
Milk and other dairy products and eggs, -1.4 percent from 5.1 percent
Vegetables and tubers and plantains, -1.6 percent from 2.6 percent
Main Contributors to the Food Inflation
Food inflation contributed 69.1 percent or 5.46 percentage points in February 2024 for this particular income group. Among the groups, the main contributor to the food inflation during the month were the following:
Cereal and cereal products, which include rice, corn, flour, bread and bakery products, pasta products and other cereals, with 60.6 percent share or 4.78 percentage points
Fish and other seafoods, with 4.2 percent share or 0.33 percentage points
Ready-made food and other food products, with 2.1 percent share or 0.17 percentage points

TECHNICAL NOTES
Consumer Price Index (CPI)
is an indicator of the change in the average retail prices of a fixed basket of goods and services
commonly purchased by households relative to a base year.
is widely used in the calculation of the inflation rate and purchasing power of the peso.
is used to adjust other economic series for price changes. Example, CPI components are used as deflators for most personal consumption expenditures (PCE) in the calculation of the Gross National Product (GNP).
is used as basis to adjust wages in labor management contracts as well as pensions and retirement benefits. Thus, increases in wages through collective bargaining agreements use the CPI as one of their bases.
Inflation Rate (IR)
interpreted in terms of declining purchasing power of peso.
is the annual rate of change or the year-on-year change of the CPI expressed in percent.
Inflation Rate (reference month, reference year)
= [(CPI (reference month, reference year) - CPI (reference month, previous year)) / CPI (reference month, previous year)] x 100%
Purchasing Power of Peso
shows how much the peso in the base period is worth in the current period.
computed as the reciprocal of the CPI for the period under review multiplied by 100.
Market Basket
is a sample of goods and services, which is meant to represent the totality of all the goods and services purchased by households relative to a base year.
To determine the commodities that will form the market basket for the 2018-based CPI, the Survey of Key Informants (SKI) was conducted in March 2021. The survey, which was conducted nationwide to store managers, sellers or proprietors, obtained information on the most commonly purchased of goods and availed of services by the households.
The commodities in the 2018-based CPI market basket are grouped/classified according to the 2020 Philippine Classification of Individual Consumption According to Purpose (PCOICOP) which is based on the United Nations COICOP. Meanwhile, the commodities in the 2012-based CPI market basket used the 2009 PCOICOP version of classification of commodities.
Base year
is a reference period, usually a year, at which the index number is set to 100. It is the reference point of the index number series. The CPI is rebased from base year 2012 to base year 2018.
| Attachment | Size |
|---|---|
|
|
244.99 KB |