

Release Date :
Reference Number :
SR-25-014
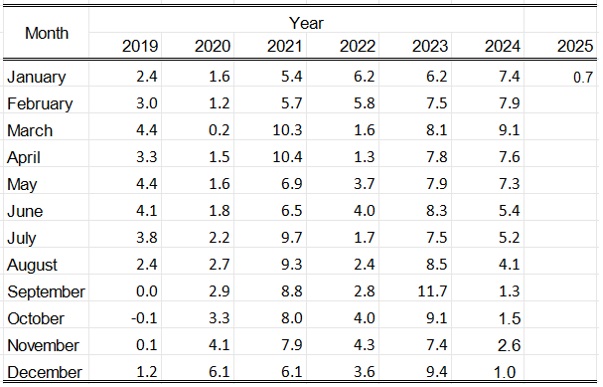
Table 1. Year-on-Year Inflation Rates: Philippines, MIMAROPA, and Romblon: Bottom 30% (2018=100)

Romblon’s inflation rate for the bottom 30% income households decelerated further to 0.7 percent in January 2025 from 1.0 percent in the previous month. In Januatu 2024, the inflation rate was posted at 7.4 percent (Table 1). Meanwhile, the average inflation for the year was computed at 0.7 percent.
The main contributor to the inflation trend of this income group in January 2025 was the Food and Non-alcoholic Beverages with -0.2 percent (with 64.8% contribution to overall inflation), from 0.1 percent in the previous month. It was followed by Housing, Electricity, Gas and Other Fuels with 5.5 percent (11.4% contribution to overall inflation), Alcoholic Beverages and Tobacco with 0.5 percent (9.1% contribution to overall inflation), Health with -1.1 percent (7.7% contribution to overall inflation), Furnishings, Household Equipment and Routine Household Maintenance with -4.7 percent (4.5% contribution to overall inflation) and Clothing and Footwear with 0.3 percent (2.5% contribution to overall inflation).
The following commodity groups showed accelerating year-on-year growth rate in January 2025.
a. Transport, -0.4% (from -0.8% during previous month)
b. Recreation, Sports and Culture, 5.8% (from 5.1% during previous month)
c. Financial Services, 0.0% (from -11.1% during the previous month)
Meanwhile, Information and Communication (0.0%), Education Services (0.0%), Restaurant and Accommodation Services (4.0%) and Personal Care and Miscellaneous Goods and Services (-0.1%) remained at their previous month’s rate.
Main Contributor to the Overall Inflation
The following commodity groups were the top 3 contributors to the January 2025 overall inflation for the bottom 30% income households:
a. Housing, Water, Electricity, Gas and Other Fuels, 94.9% share or 0.66 percentage points
b. Restaurant and Accommodation Services, 26.7% share or 0.19 percentage points
c. Recreation, Sports and Culture, 7.0% or 0.05 percentage points
Food Inflation
Food inflation for the bottom 30% income households at the provincial level moved at a faster pace of 4.0 percent in January 2025 from 3.5 percent in the previous month. In January 2024, its annual increase was observed at 3.3 percent.
Main Drivers to Upward Trend of Food Inflation
The upward trend in food inflation was mainly due to faster annual increase of vegetables and tubers with 21.1 percent in January 2025 from 14.2 percent in the previous month.
Main Contributors to the Food Inflation
Among the commodity groups, the main contributors to the food inflation during January 2025 were the following:
a. Vegetables and tubers, 21.1% (1.86 percentage points)
b. Meat and other parts of slaughtered land animals, 6.4% (1.30 percentage points)
c. Fish and other seafood, 3.3% (0.59 percentage points)
(SGD) ENGR. JOHNNY F. SOLIS
Chief Statistical Specialist
Table 2. Year-on-Year Inflation Rates for the Bottom 30% Income Households in Romblon, All Items: January 2019 to January 2025, in percent. (2018=100)
| Attachment | Size |
|---|---|
|
|
184.72 KB |
|
|
185.69 KB |