

Release Date :
Reference Number :
2024 - 011
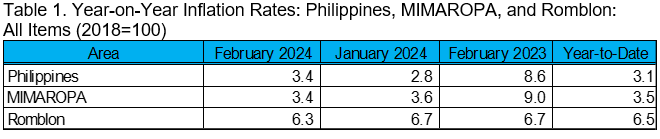
The headline inflation rate of Romblon further decelerated to 6.3 percent in February 2024, compared to the 6.7 percent computed in the previous month. Compared to the previous year, its inflation rate was lower than the registered 6.7 percent in February 2023.
The inflation trend in February 2024 was primarily brought by the slowing down of the year-on-year growth rate in the indices of the commodity group such as:
- Alcoholic Beverages and Tobacco, 14.2% (6.5% share to inflation trend)
- Clothing and Footwear, 5.7% (13.7% share to inflation trend)
- Housing, Water, Electricity, Gas and Other Fuels, 0.2% (5.0% share to inflation trend)
- Furnishings, Household Equipment and Routine Household Maintenance, 8.0% (12.4% share to inflation trend)
- Transportation, 0.6% (2.2% share to inflation trend)
- Information and Communication, (0.8%) (1.7% share to inflation trend)
- Recreation, Sports and Culture, 5.2% (4.3% share to inflation trend)
- Restaurant and Accommodation Services, 13.2% (36.5% share to inflation trend)
- Personal Care, and Miscellaneous Goods and Services, 5.8% (17.7% share to inflation trend)
On the other hand, Food and Non-alcoholic Beverages (8.8%) and Health (2.0%) showed faster inflation rates as compared to the previous month’s rate. Meanwhile, Education Services (2.6%) and Financial Services (11.1%) remained at their previous month’s rate.
In the past 12 months, the highest inflation rate was observed in the month of September 2023 computed at 9.7 percent while the lowest was observed in February 2024 at 6.3 percent (Figure 1).
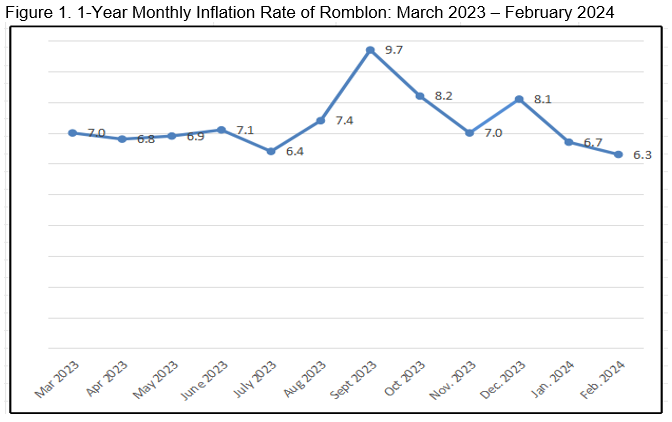
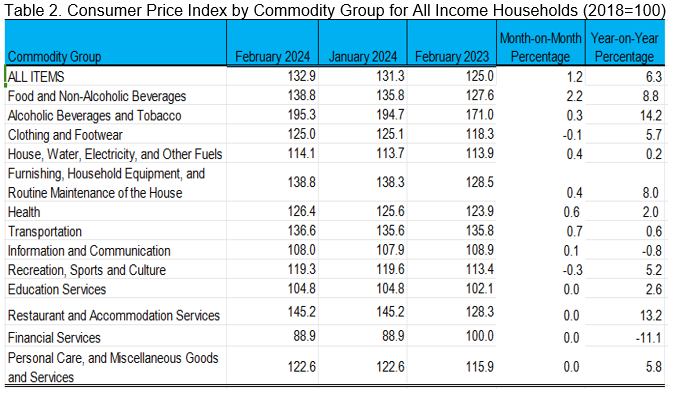
Table 2 shows that the month-on-month price index for all items in the province increased by 1.2 percent (131.3 to 132.9). It also shows that Food and Non-alcoholic Beverages registered the highest increment with reference to the price situation in the previous month, increased by 2.2 percent (135.8 to 138.8). It was followed by the observed price situation of Transportation with 0.7 percent (135.6 to 136.6), Health with 0.6 percent (125.6 to 126.4), House, Water, Electricity and Other Fuels with 0.4 percent (113.7 to 114.1), Furnishing, Household Equipment and Routine Maintenance of the House with 0.4 percent (138.3 to 138.8), Alcoholic Beverages and Tobacco with 0.3 percent (194.7 to 195.3) and Information and Communication with 0.1 percent (107.9 to 108).
On the other hand, commodity groups that showed decreased indices include Recreation, Sports and Culture with -0.3 percent (119.6 to 119.3), and Clothing and Footwear with -0.1 percent (125.1 to 125.0).
Meanwhile, there is no observed month-on-month changes in average prices of Education Services, Restaurant and Accommodation Services, Financial Services and Personal Care and Miscellaneous Goods and Services.
The average monthly CPI for all income households in the province in February 2024 was recorded at 132.9, increased by 6.3 percent from the price level on the same month of the past year (125.0).
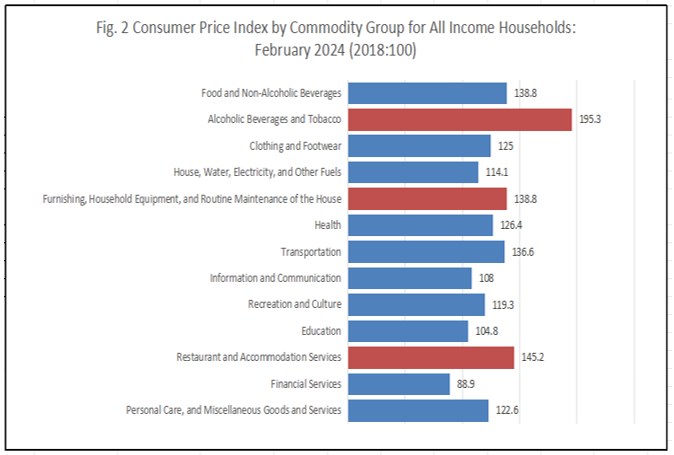
Meanwhile, Figure 2 shows the Consumer Price Indices of different commodity groups in February 2024. The commodity group of Alcoholic Beverages and Tobacco registered 195.3, the highest value of the CPI in the province during the period.
Purchasing Power of Peso
CPI is further used in the computation of Purchasing Power of Peso (PPP). PPP measures the “true” value of money using a given base year.
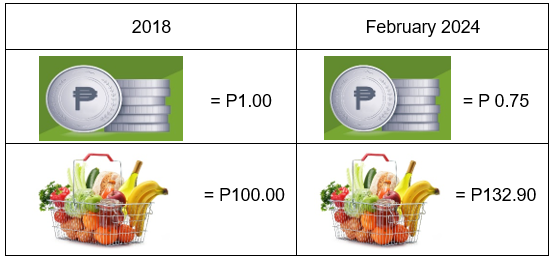
In February 2024, the PPP was calculated to have a value of P0.75 on the average, which means that P1.00 in 2018 is only worth 75 centavos. Also, on the average, an individual needs P132.90, or P32.90 more, to buy the same basket of goods that was worth P100.00 in 2018.
TECHNICAL NOTES
Consumer Price Index (CPI)
- is an indicator of the change in the average retail prices of a fixed basket of goods and services
- commonly purchased by households relative to a base year.
- is widely used in the calculation of the inflation rate and purchasing power of the peso.
- is used to adjust other economic series for price changes. Example, CPI components are used as deflators for most personal consumption expenditures (PCE) in the calculation of the Gross National Product (GNP).
- is used as basis to adjust wages in labor management contracts as well as pensions and retirement benefits. Thus, increases in wages through collective bargaining agreements use the CPI as one of their bases.
Inflation Rate (IR)
- interpreted in terms of declining purchasing power of peso.
- is the annual rate of change or the year-on-year change of the CPI expressed in percent.
Inflation Rate (reference month, reference year)
= [(CPI (reference month, reference year) - CPI (reference month, previous year)) / CPI (reference month, previous year)] x 100%
Purchasing Power of Peso
- shows how much the peso in the base period is worth in the current period.
- computed as the reciprocal of the CPI for the period under review multiplied by 100.
Market Basket
- is a sample of goods and services, which is meant to represent the totality of all the goods and services purchased by households relative to a base year.
- To determine the commodities that will form the market basket for the 2018-based CPI, the Survey of Key Informants (SKI) was conducted in March 2021. The survey, which was conducted nationwide to store managers, sellers or proprietors, obtained information on the most commonly purchased of goods and availed of services by the households.
- The commodities in the 2018-based CPI market basket are grouped/classified according to the 2020 Philippine Classification of Individual Consumption According to Purpose (PCOICOP) which is based on the United Nations COICOP. Meanwhile, the commodities in the 2012-based CPI market basket used the 2009 PCOICOP version of classification of commodities.
Base year
- is a reference period, usually a year, at which the index number is set to 100. It is the reference point of the index number series. The CPI is rebased from base year 2012 to base year 2018.
| Attachment | Size |
|---|---|
|
|
344.19 KB |