

Release Date :
Reference Number :
2022-023
Table A. Year-on-Year Inflation Rates: Philippines, MIMAROPA, and the City of Puerto Princesa All Items, In Percent (2018=100)
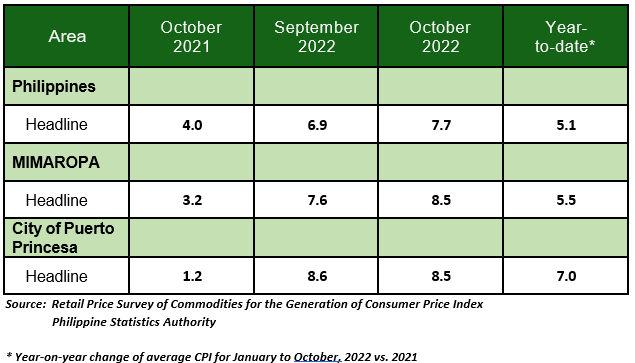
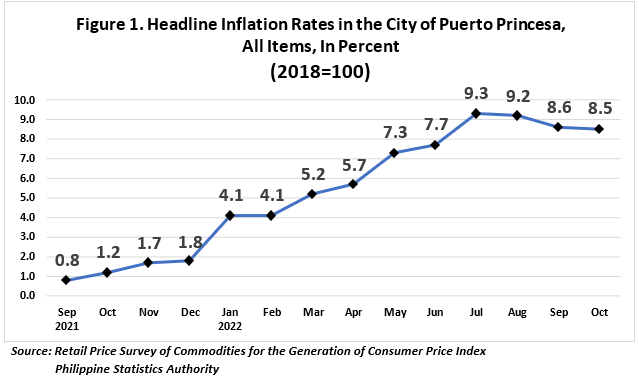
The headline inflation in the City of Puerto Princesa continued to display a downward trend as it moved to 8.5 percent in October 2022, from 8.6 percent in September 2022 and 9.2 percent in August of the same year. The average inflation for the first ten months of the year stood at 7.0 percent. (Table A and Figure 1)
The main cause of the downtrend was the lower index for transport at 12.1 percent, from 14.5 percent in the previous month. Housing, Water, Electricity, Gas, and other fuels at 1.8 percent also declined, from the previously recorded 2.5 percent in September 2022. Another contributor to the downward trend was Information and communication at 1.5 percent, from 1.8 percent in the previous month. (Table B).
On the other hand, the following commodity groups exhibited higher indices for this month:
a. Food and Non-Alcoholic Beverages, 13.2 percent.
b. Clothing and footwear, 11.1 percent.
c. Furnishings, Household Equipment and Routine, Household Maintenance, 6.4 percent.
d. Health, 3.8 percent.
e. Recreation, sport and culture, 8.0 percent.
f. and Personal care and miscellaneous good and services, 7.3 percent.
Meanwhile, Education Services and Financial Services retained their previous month’s inflation rate.
Table B. Year-on-Year Inflation Rates in City of Puerto Princesa, All Items, In Percent (2018=100)

Food index for October 2022 was posted at 13.7 percent, higher than its previous month’s value of 13.3 percent. In September 2021, the food index was lower, at -0.4 percent (Table C).
During this period, major contributors to the growth in the food index are Fruits and Nuts, at 20.5 percent followed by Vegetables, tubers, plantains, cooking bananas and pulses at 12.3 percent, and Rice at 5.6 percent. In addition, higher growth rate was also observed in Sugar, Confectionery and desserts at 36.7 percent, Flour, Bread and Other Bakery Products, Pasta Products, and Other Cereals at 13.9 percent, and Milk, other dairy products and eggs, at 8.0 percent.
Table C. Year-on-Year Inflation Rates in City of Puerto Princesa, By Food Group, In Percent (2018=100)
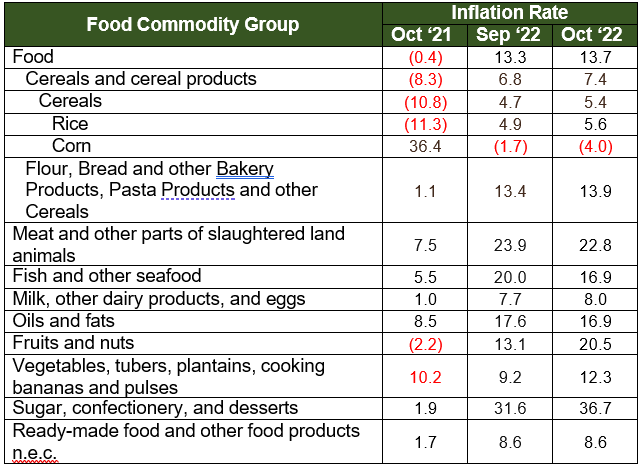
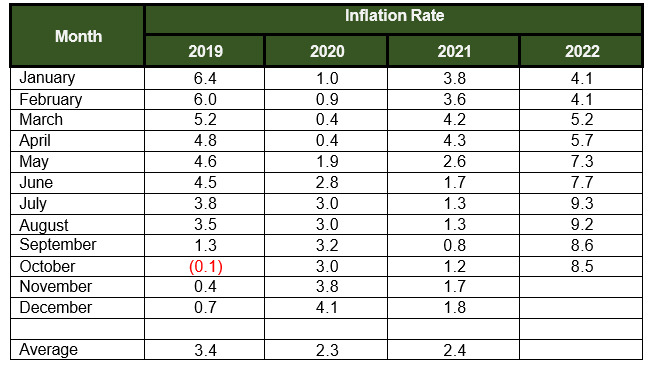
Table D. Year-on-Year Inflation Rates in City of Puerto Princesa, All Items, In Percent January 2019 – October 2022 (2018=100)
| Attachment | Size |
|---|---|
|
|
171.39 KB |