

Release Date :
Reference Number :
2025-SR-021
Table A. Year-on-Year Inflation Rates for All Income Households:
Philippines, MIMAROPA, and Puerto Princesa City
All Items, In Percent
(2018=100)
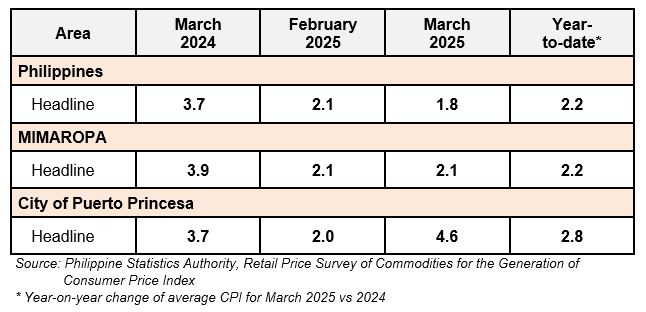
The headline inflation in the City of Puerto Princesa accelerated to 4.6 percent in March 2025, from 2.0 percent in the previous month. In March 2024, inflation rate is lower at 3.7 percent. (Table A and Figure 1)
The overall inflation rate in Puerto Princesa City is faster at 4.6 percent. The result was primarily brought by the higher index for food and non-alcoholic beverage posted at 5.9 percent from 1.0 percent in February 2025. This was followed by information and communication at 28.2 percent from -0.2 percent and restaurants and accommodation services which posted an inflation rate of 11.2 percent from 8.7 percent.
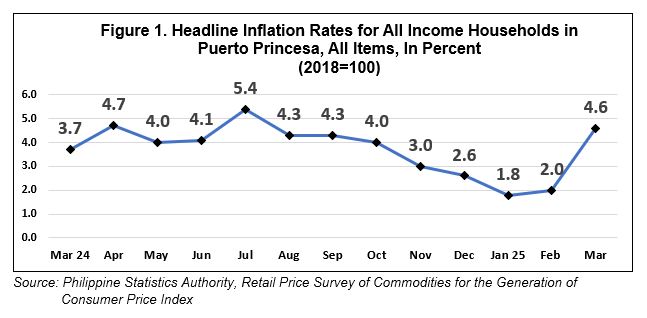
Table B. Year-on-Year Inflation Rates for All Income Households in
Puerto Princesa City, All Items, In Percent
(2018=100)
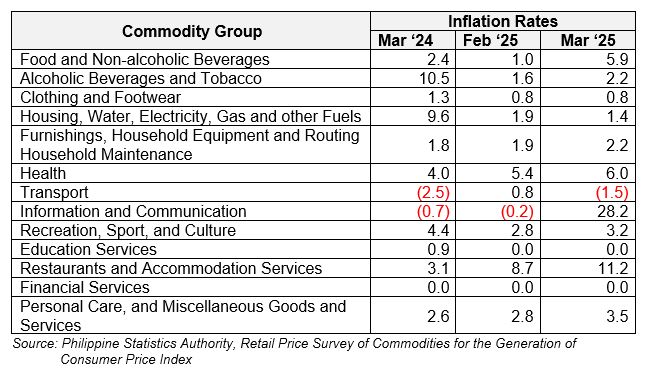
The following commodity groups also exhibited higher annual increments:
a) Personal care and miscellaneous goods and service, 3.5 percent from 2.8 percent;
b) Health, 6.0 percent from 5.4 percent;
c) Alcoholic beverages and tobacco, 2.2 percent from 1.6 percent;
d) Furnishings, household equipment and routine household maintenance, 2.2 percent from1.9 percent; and
e) Recreation, sport and culture, 3.2 percent from 2.8 percent.
Meanwhile, lower inflation rates were observed in the indices of housing, water, electricity, gas and other fuels at 1.4 percent from 1.9 percent and transport at -1.5 percent from 0.8 percent.
On the other hand, Clothing and footwear, Education and Financial Services retained its previous month’s levels.
Table C. Year-on-Year Inflation Rates for All Income Households in
Puerto Princesa City, By Food Group In Percent
(2018=100)
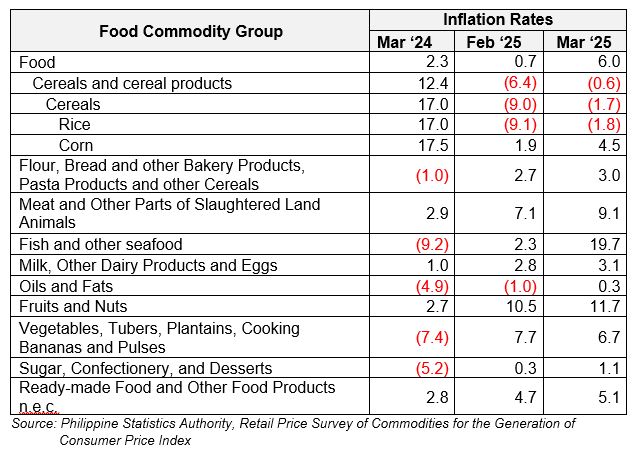
Food index for March 2025 accelerated to 6.0 percent inflation rate from 0.7 percent in the previous month. In March 2024, the food index was lower at percent inflation rate. (Table C).
The uptrend in the food inflation for the month was brought about by the higher index for fish and other seafood at 19.7 percent inflation rate from 2.3 percent last month. This was followed by cereals and cereal products at -0.6 percent from -6.4 percent and meat and other parts of slaughtered land animals at 9.1 percent inflation rate, from 7.1 percent.
Furthermore, higher inflation rates were also observed in the following food groups:
a) Fruits and nuts, 11.7 percent from 10.5 percent;
b) Sugar, confectionery and desserts, 1.1 percent from 0.3 percent;
c) Oils and fats, 0.3 percent from -1.0 percent
d) Milk other dairy products and eggs, 3.1 percent from 2.8 percent;
e) Ready-made food and other products n.e.c., 5.1 percent from 4.7 percent
On the other hand, lower annual increment was observed in vegetables, tubers, plantains, cooking bananas and pulses with 6.7 percent from 7.7 percent in the previous month.
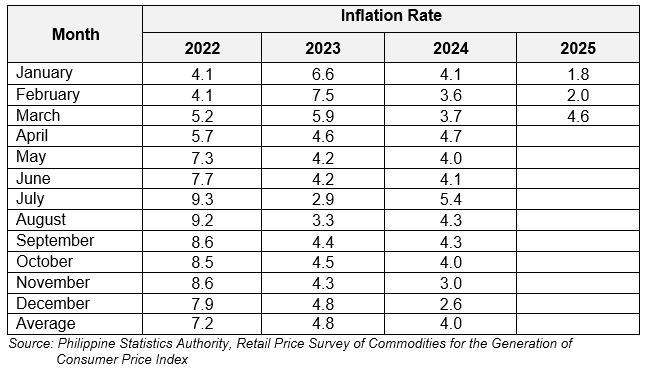
Table D. Year-on-Year Inflation Rates in Puerto Princesa City,
All Items, In Percent
January 2022 – March 2025
(2018=100)
(SGD) DONNA MARIE D. MOBE
(Supervising Statistical Specialist)
Officer-In-Charge
Palawan Provincial Statistical Office
MQV
Technical Notes
Consumer Price Index is an indicator of the change in the average prices of a fixed basket of goods and services commonly purchased by households relative to a base year.
• Market Basket is a sample of goods and services, which is meant to represent the totality of all the goods and services purchased by households relative to a base year.
o To determine the commodities that will form the market basket for the 2018-based CPI, the Survey of Key Informants (SKI) was conducted in March 2021. The survey, which was conducted nationwide to store managers, sellers or proprietors, obtained information on the most commonly purchased of goods and availed of services by the households.
o The commodities in the 2018-based CPI market basket are grouped/classified according to the 2020 Philippine Classification of Individual Consumption According to Purpose (PCOICOP) which is based on the United Nations COICOP. Meanwhile, the commodities in the 2012-based CPI market basket used the 2009 PCOICOP version of classification of commodities.
• Base year is a reference period, usually a year, at which the index number is set to 100. It is the reference point of the index number series. The CPI is rebased from base year 2012 to base year 2018.
• Inflation Rate is the annual rate of change or the year-on-year change in the Consumer Price Index (CPI).