

Release Date :
Reference Number :
2025-SR-024
Table A. Year-on-Year Inflation Rates for the Bottom 30% Income Households: Philippines, MIMAROPA, and Palawan
All Items, In Percent
(2018=100)
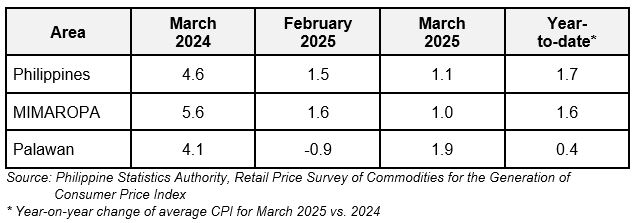
Palawan’s inflation rate for the bottom 30% income households increased to 1.9 percent in March 2025 from a 0.9 percent decline in February 2025. In March 2024, inflation rate was posted at 4.1 percent. (Table A and Figure 1)
The main driver to the upward trend in the provincial inflation for this income group in March 2025 was the higher year-on-year growth in the heavily-weighted food and non-alcoholic beverages at 1.7 percent from a 2.9 percent annual decline in February 2025. Also contributing to the increase to the overall inflation of the province is information and communication at 23.7 percent in March 2025 from 7.9 percent in the previous month, and restaurants and accommodation services at 7.3 percent during the month from 6.0 percent in February 2025.
Moreover, higher inflation rates were also noted in the indices of clothing and footwear at 1.4 percent in March 2025 from 1.3 percent in February 2025; recreation, sport and culture at 1.1 percent during the month from 0.8 percent in the previous month; and personal care and miscellaneous goods and services at 3.1 percent in the current month from 2.4 percent in February 2025.
Table B. Year-on-Year Inflation Rates for the Bottom 30% Income Households
in Palawan, All Items, In Percent
(2018=100)
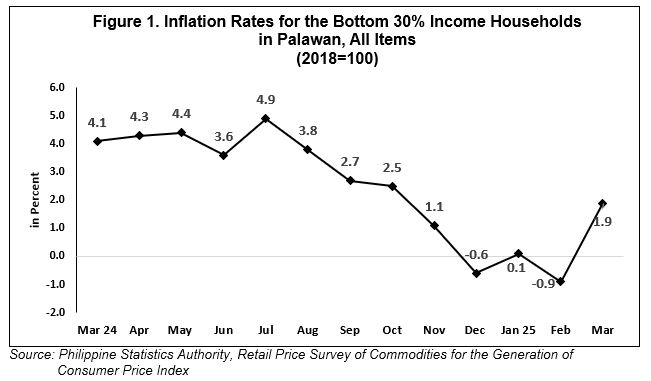
Table B. Year-on-Year Inflation Rates for the Bottom 30% Income Households
in Palawan, All Items, In Percent
(2018=100)
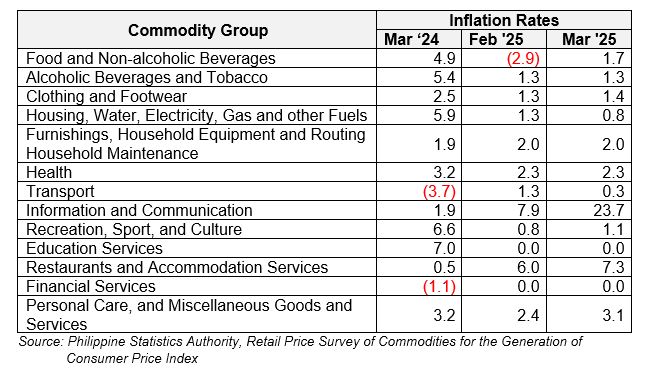
In contrast, lower annual growth rates were noted in the indices of housing, water, electricity, gas and other fuels and transport at 0.8 percent and 0.3 percent, respectively in March 2025 from both their February 2025 rates of 1.3 percent.
Further, the indices of the following commodity groups retained their respective February 2025 annual rates:
a.) Alcoholic beverages and tobacco, 1.3 percent;
b.) Furnishings, household equipment and routine household maintenance, 2.0 percent;
c.) Health, 2.3 percent;
d.) Education services, 0.0 percent; and
e.) Financial services, 0.0 percent.
Table C. Year-on-Year Inflation Rates for the Bottom 30% Income Households
in Palawan, By Food Group, In Percent
(2018=100)

Food inflation for the bottom 30% income households in Palawan moved at a faster pace of 1.4 percent in March 2025 from a 3.3 percent annual decline in the previous month. In March 2024, its annual increase was observed at 5.0 percent. (Table C)
The uptrend in the food inflation in the province was mainly due to the faster growth in the rice index at an annual decline of 7.4 percent during the month from a 13.9 percent annual decrease in the previous month. Higher inflation rates were also noted in March 2025 in the indices of fish and other seafood at 10.6 percent and vegetables, tubers, plantains, cooking bananas and pulses at 9.6 percent from their corresponding February 2025 inflation rates of 2.0 percent and 5.4 percent, respectively.
Moreover, higher annual increases were also noted in the following food groups:
a. Corn, 21.4 percent from 3.3 percent;
b. Milk, other dairy products and eggs, 3.6 percent from 2.0 percent;
c. Oils and fats, 19.1 percent from 13.7 percent;
d. Fruits and nuts, 8.9 percent from 2.6 percent; and
e. Ready-made food and other food products n.e.c,, 3.2 percent from 2.0 percent.
Meanwhile, the indices for flour, bread and other bakery products pasta products and other cereals, meat and other parts of slaughtered land animals, and sugar, confectionery and desserts recorded slower annual increases in March 2025 at 0.8 percent, 11.5 percent, and 2.0 percent, respectively as compared to their corresponding previous month’s rates of 1.2 percent, 11.7 percent, and 2.3 percent.
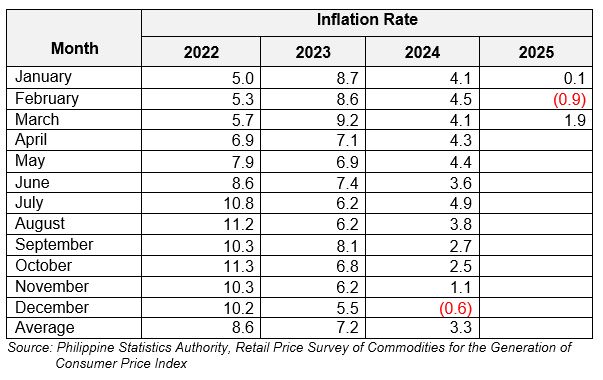
Table D. Year-on-Year Inflation Rates for the Bottom 30% Income Households
in Palawan, All Items, In Percent
January 2022 – March 2025
(2018=100)
(SGD) DONNA MARIE D. MOBE
(Supervising Statistical Specialist)
Officer-in-Charge
Palawan Provincial Statistical Office
Technical Notes
Consumer Price Index is an indicator of the change in the average prices of a fixed basket of goods and services commonly purchased by households relative to a base year.
• Market Basket is a sample of goods and services, which is meant to represent the totality of all the goods and services purchased by households relative to a base year.
o To determine the commodities that will form the market basket for the 2018-based CPI, the Survey of Key Informants (SKI) was conducted in March 2021. The survey, which was conducted nationwide to store managers, sellers or proprietors, obtained information on the most commonly purchased of goods and availed of services by the households.
o The commodities in the 2018-based CPI market basket are grouped/classified according to the 2020 Philippine Classification of Individual Consumption According to Purpose (PCOICOP) which is based on the United Nations COICOP. Meanwhile, the commodities in the 2012-based CPI market basket used the 2009 PCOICOP version of classification of commodities.
• Base year is a reference period, usually a year, at which the index number is set to 100. It is the reference point of the index number series. The CPI is rebased from base year 2012 to base year 2018.
• Inflation Rate is the annual rate of change or the year-on-year change in the Consumer Price Index (CPI).
• CPI for Bottom 30% is an indicator of the change in the average prices of good and services commonly purchased by consumers whose per capita income fall below the bottom 30%.