

Release Date :
Reference Number :
2024-SR-48
Table 1. Year-on-Year Inflation Rates (%) for the Bottom 30% Income Households
in the Philippines and MIMAROPA Region,
by Province/Highly Urbanized City (HUC)
(2018=100)
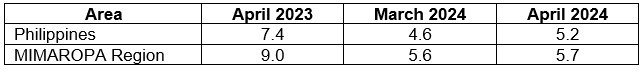
Figure 1. Year-on-Year Inflation Rates (%) for the Bottom 30% Income Households
in MIMAROPA: April 2023 to April 2024
(2018=100)
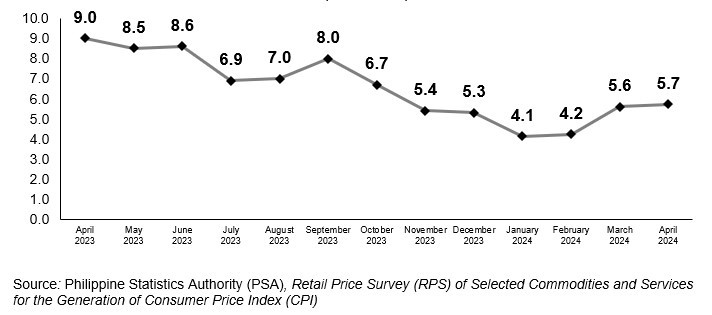
The inflation rate at the regional level, for the bottom 30% income households slightly accelerated to 5.7 percent in April 2024, from the 5.6 percent inflation in the previous month. The index was recorded at 9.0 percent in the same reference month of the previous year. The main contributors to the uptrend of inflation were housing, water, electricity, gas and other fuels, with 4.6 percent inflation, food and non-alcoholic beverages, with 7.3 percent inflation, and transport, with -2.1 percent.
INFLATION RATE BY COMMODITY GROUP
Figure 2. Year-on-Year Inflation Rates (%) for the Bottom 30% Income Households
in MIMAROPA, by Commodity Group
(2018=100)
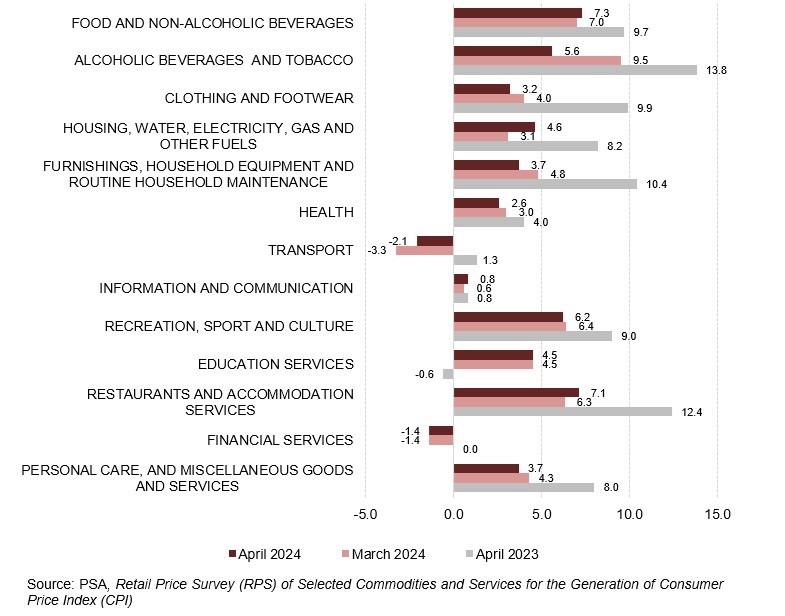
Moreover, the following commodity groups also exhibited a faster growth in April 2024:
• Information and Communication, 0.8%; and
• Restaurants and Accommodation Services, 7.1%.
On the other hand, lower annual gains were observed in the inflation rates of the following commodity groups:
• Alcoholic Beverages and Tobacco, 5.6%;
• Clothing and Footwear, 3.2%;
• Furnishings, Household Equipment and Routine Household Maintenance, 3.7%;
• Health, 2.6%;
• Recreation, Sport, and Culture, 6.2%;
• Personal Care, and Miscellaneous Goods and Services, 3.7%.
Meanwhile, commodity groups of education and financial services retained their previous month’s inflation rate of 4.5 percent and -1.4 percent, respectively.
INFLATION RATE BY FOOD GROUP
Figure 3. Year-on-Year Inflation Rates (%) for the Bottom 30% Income Households
in MIMAROPA, by Food Group
(2018=100)
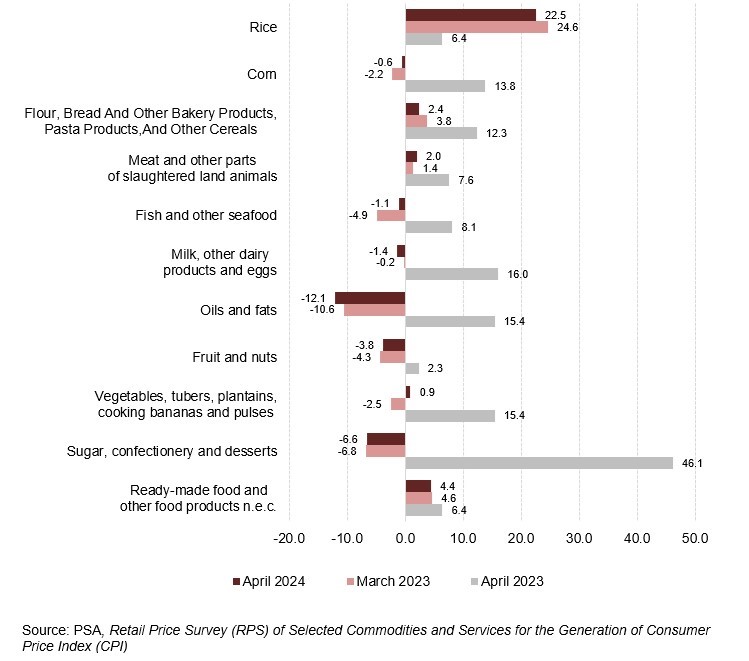
The region’s food index accelerated to 7.7 percent in April 2024, from 7.4 percent in the previous month, and 9.7 percent in April 2023. Moreover, the uptrend in food inflation were mainly contributed by fish and other seafood, with -1.1 percent inflation, vegetables, tubers, plantains, cooking bananas and pulses, with 0.9 percent inflation, and meat and other parts of slaughtered land animals, with 2.0 percent inflation.
On the other hand, the annual indices of the following food items exhibited slower growth in April 2024:
• Rice, 22.5%;
• Flour, Bread and Other Bakery Products, Pasta Products, and Other Cereals, 2.4%;
• Milk, other dairy products and eggs, -1.4%;
• Oils and fats, -12.1%; and
• Ready-made food and other food products, not elsewhere classified, 4.4%.
INFLATION RATE BY PROVINCE
Figure 4. Year-on-Year Inflation Rates (%) for the Bottom 30% Income Households
in MIMAROPA, by Province
(2018=100)
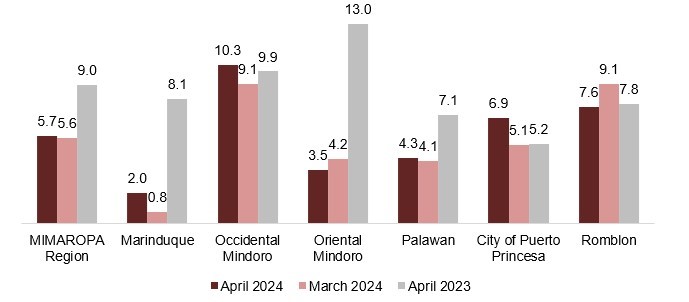
Among the provinces and HUC in the region, Occidental Mindoro had the highest inflation for the bottom 30 percent income households, with 10.3 percent, while Marinduque posted the lowest, with 2.0 percent.
Additionally, four areas recorded faster growths in April 2024, compared with the previous month:
• Marinduque, 2.0%;
• Occidental Mindoro, 10.3%;
• Palawan, 4.3%; and
• City of Puerto Princesa, 6.9%.
The provinces of Oriental Mindoro and Romblon showed an ease in their inflation, with 3.5 percent and 7.6 percent, respectively.
Of the 5.7 percent inflation in the MIMAROPA Region, the province of Occidental Mindoro posted the largest contribution, with 2.1 percentage points. This was followed by Palawan and Romblon, with 1.4 percentage points and 0.9 percentage point, respectively.
TECHNICAL NOTES
• Consumer Price Index is an indicator of the change in the average prices of a fixed basket of goods and services commonly purchased by households relative to a base year.
• Market Basket is a sample of goods and services, which is meant to represent the totality of all the goods and services purchased by households relative to a base year.
o To determine the commodities that will form the market basket for the 2018-based CPI, the Survey of Key Informants (SKI) was conducted in March 2021. The survey, which was conducted nationwide to store managers, sellers or proprietors, obtained information on the most commonly purchased of goods and availed of services by the households.
o The commodities in the 2018-based CPI market basket are grouped/classified according to the 2020 Philippine Classification of Individual Consumption According to Purpose (PCOICOP) which is based on the United Nations COICOP. Meanwhile, the commodities in the 2012-based CPI market basket used the 2009 PCOICOP version of classification of commodities.
• Base year is a reference period, usually a year, at which the index number is set to 100. It is the reference point of the index number series. The CPI is rebased from base year 2012 to base year 2018.
• Inflation Rate is the annual rate of change or the year-on-year change in the Consumer Price Index (CPI).
• Purchasing Power of Peso is a measure of the real value of the peso in a given period relative to a chosen reference period. It is computed by getting the reciprocal of the CPI and multiplying the result by 100.
Inflation Rate (reference month, reference year)
= [(CPI (reference month, reference year) - CPI (reference month, previous year)) / CPI (reference month, previous year)] x 100%
For example,
INFLATION RATE (April 2024) = [(CPI (April 2024) - CPI (April 2023)) / CPI (April 2023)] x 100%
= [(134.0 – 126.8) / 126.8] x 100%
= (7.2 / 126.8) x 100%
≈ 5.7%
(SGD) LENI R. RIOFLORIDO
Regional Director
MLLM/OHG/APAR
| Attachment | Size |
|---|---|
|
|
1.64 MB |
|
|
604.98 KB |