

Release Date :
Reference Number :
2024-SR-76
Table 1. Year-on-Year Inflation Rates (%) in the Philippines and MIMAROPA Region,
by Province/Highly Urbanized City (HUC)
(2018=100)
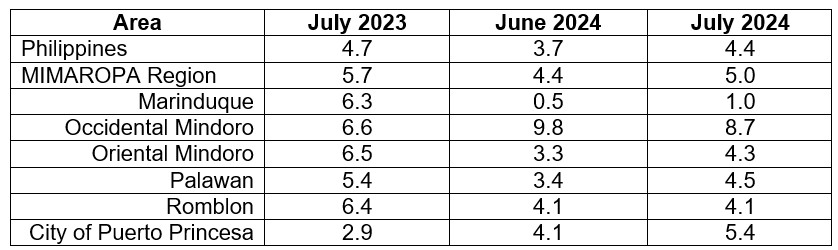
Figure 1. Year-on-Year Inflation Rates (%) in MIMAROPA:
July 2023 to July 2024
(2018=100)
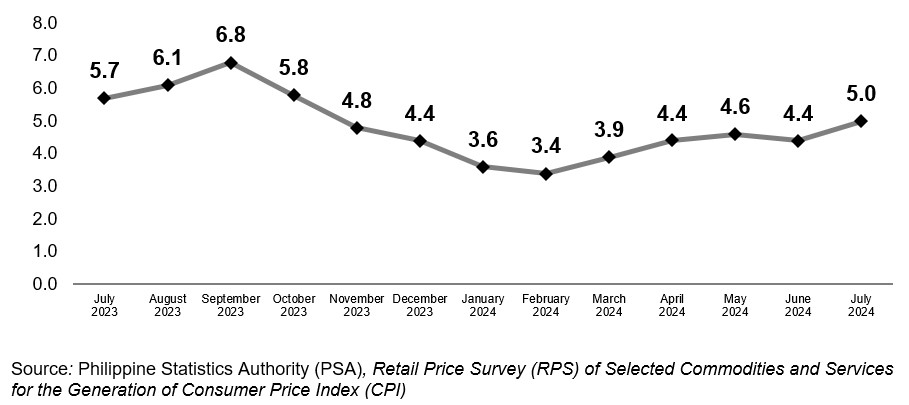
The headline inflation rate at the regional level further increased to 5.0 percent in July 2024, from the 4.4 percent in the previous month. In the same reference month of the previous year, the index posted at 5.7 percent. The main contributors to the uptrend of inflation were food and non-alcoholic beverages, with 5.5 percent inflation; housing, water, electricity, gas and other fuels, with 7.4 percent inflation; and transport with 0.8 percent inflation.
INFLATION RATE BY COMMODITY GROUP
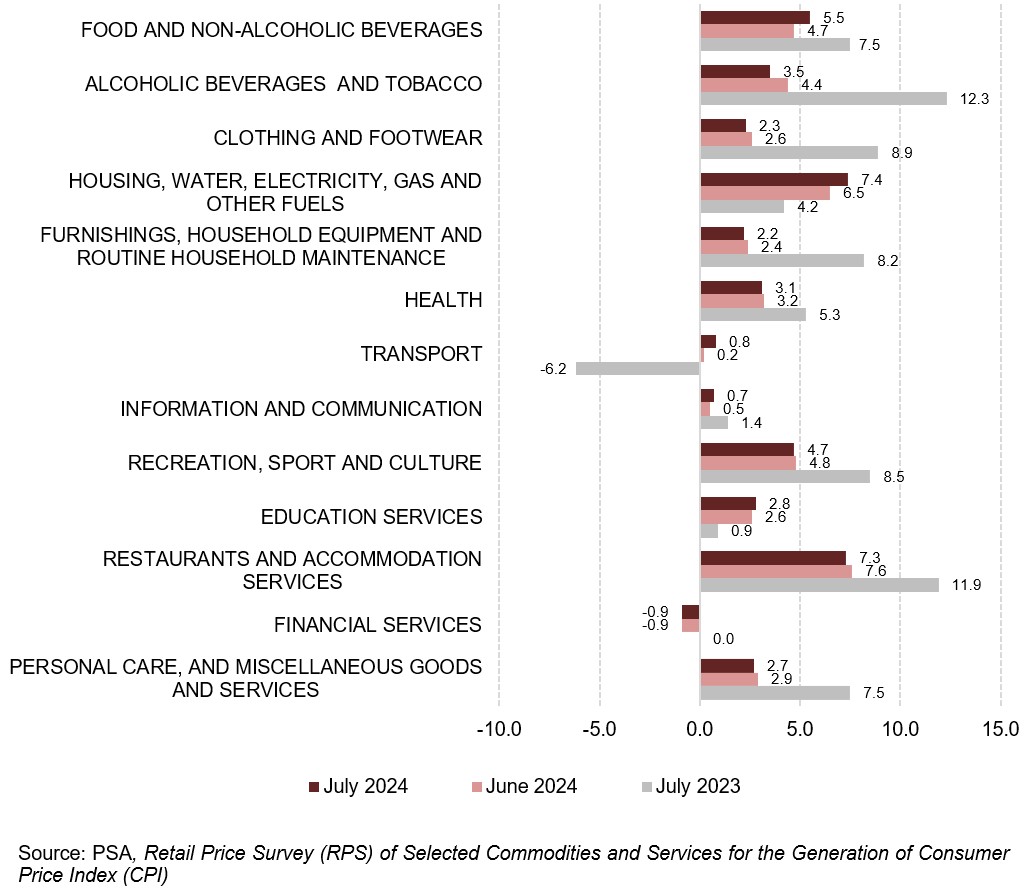
Moreover, the following commodity groups exhibited a higher annual gain in July 2024:
• Information and Communication, 0.7%; and
• Education Services, 2.8%;
On the other hand, slower growths were observed in the following:
• Alcoholic Beverages and Tobacco, 3.5%;
• Clothing and Footwear, 2.3%;
• Furnishings, Household Equipment and Routine Household Maintenance, 2.2%;
• Health, 3.1%;
• Recreation, Sport and Culture, 4.7%
• Restaurants and Accommodation Services, 7.3%
• Personal Care, And Miscellaneous Goods and Services, 2.7%.
Meanwhile, financial services retained its previous month’s inflation rate of -0.9 percent.
INFLATION RATE BY FOOD GROUP
Figure 3. Year-on-Year Inflation Rates (%) in MIMAROPA,
by Food Group
(2018=100)
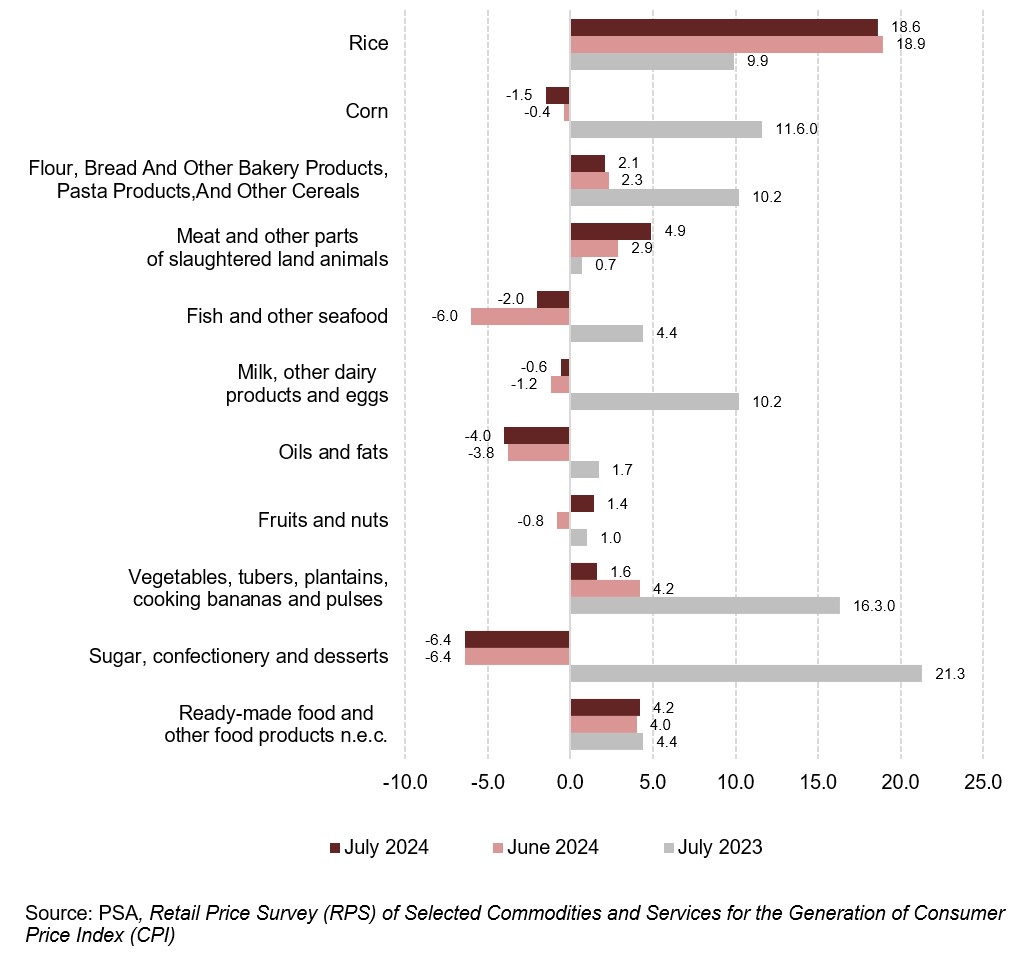
The region’s food index accelerated to 5.8 percent in July 2024, from 4.8 percent in the previous month. In July 2023, the food inflation rate was higher at 7.4 percent. Moreover, the uptrend in July 2024 food index was mainly contributed by fish and other seafood, at -2.0 percent inflation; meat and other parts of slaughtered land animals, with 4.9 percent inflation; and fruits and nuts, 1.4 percent inflation.
On the other hand, the annual indices of the following food items exhibited a slower growth, when compared with the annual figures from the previous month:
• Rice, 18.6%;
• Corn, -1.5%;
• Flour, bread and other bakery products, pasta products, and other cereals, 2.1%;
• Oils and fats, -4.0%; and
• Vegetables, tubers, plantains, cooking bananas and pulses, 1.6%.
PURCHASING POWER OF PESO
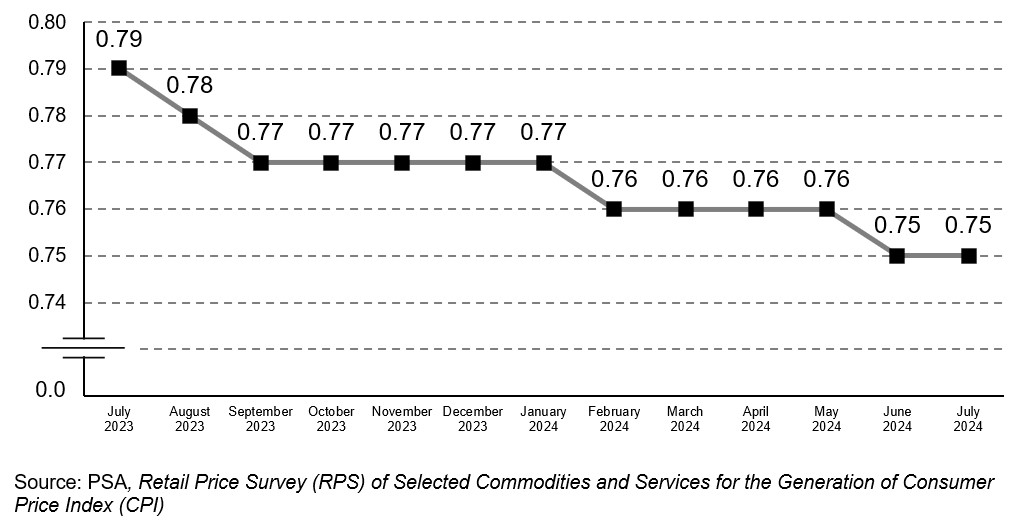
The Purchasing Power of Peso (PPP) in the MIMAROPA Region retained at
Php 0.75 in July 2024. The PPP registered at Php 0.79 in July 2023. As a result, the amount of goods that can be presently purchased by consumers was fewer compared to when the PPP was higher. Furthermore, the decrease in PPP was attributed to the higher inflation rate, given that they have an inverse relationship.
Figure 4. Purchasing Power of Peso in MIMAROPA Region:
July 2023 to July 2024
(2018=100)
| Attachment | Size |
|---|---|
|
|
963.72 KB |
|
|
339.41 KB |
|
|
592.65 KB |