

Release Date :
Reference Number :
SR-2025-022
Table 1. Year-on-Year Inflation Rates: Philippines, MIMAROPA, and Romblon: Bottom 30% (2018=100)
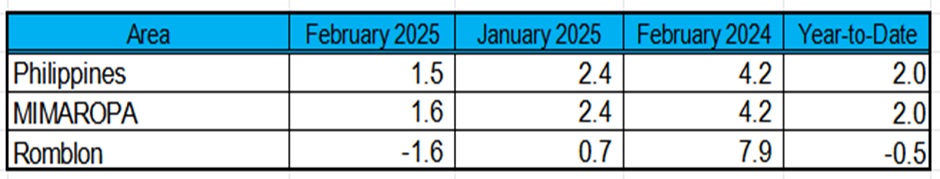
Source: Philippine Statistics Authority, Retail Price Survey of Commodities
Romblon’s inflation rate for the bottom 30% income households shows lower average prices at -1.6 percent rate in February 2025 from 0.7 percent in the previous month. In February 2024, the inflation rate was posted at 7.9 percent (Table 1). Meanwhile, the average inflation for the year was computed at -0.5 percent.
The main contributor to the inflation trend of this income group in February 2025 was the Food and Non-alcoholic Beverages with -3.9 percent (with 94.2% contribution to overall inflation), from -0.2 percent in the previous month. It was followed by Housing, Electricity, Gas and Other Fuels with 5.0 percent (3.4% contribution to overall inflation), Transport with -1.1 percent (1.7% contribution to overall inflation), Health with -2.1 percent (0.5% contribution to overall inflation), and Furnishings, Household Equipment and Routine Household Maintenance with -4.9 percent (0.2% contribution to overall inflation).
The following commodity groups showed accelerating year-on-year growth rate in February 2025.
a. Alcoholic Beverages and Tobacco, 1.7% (from 0.5% during previous month)
b. Recreation, Sports and Culture, 6.0% (from 5.8% during previous month)
c. Personal Care and Miscellaneous Goods and Services, 0.0% (from -0.1% during the previous month)
Meanwhile, Clothing and Footwear (0.3%), Information and Communication (0.0%), Education Services (0.0%), Restaurant and Accommodation Services (4.0%) and Financial Services (-0.1%) remained at their previous month’s rate.
Main Contributor to the Overall Inflation
The following commodity groups were the top 3 contributors to the February 2025 overall inflation for the bottom 30% income households:
a. Fish and other Seafoods, 54.0% share or -0.86 percentage points
b. Cereals and cereal products, 53.2% share or -0.85 percentage points
c. Milk, other dairy products and eggs, 28.9% or -0.46 percentage points
Food Inflation
Food inflation for the bottom 30% income households at the provincial level slowed down to -3.2 percent in February 2025 from 0.1 percent in the previous month. In February 2024, its annual increase was observed at 8.9 percent.
Main Drivers to Downward Trend of Food Inflation
The downward trend in food inflation was mainly due to faster annual decline in the index of cereals and cereal products with -2.7 percent in February 2025 from 5.2 percent in the previous month.
In addition, lower inflation rates during the month were noted on the following food groups:
a. vegetables, tubers and plantains, -4.4 percent from 2.8 percent
b. milk, other dairy products and eggs, -11.0 percent from -8.0 percent
c. fruits and nuts, -10.0 percent from -9.5 percent
In contrast, higher annual increases were noted on the following food items:
a. fish and other seafoods, -7.8 percent from -8.2 percent
b. meat and other parts of slaughtered animal, 5.4 percent from 4.6 percent
Main Contributors to the Food Inflation
Among the commodity groups, the main contributors to the food inflation during February 2025 were the following:
a. Fish and other seafood, -5.5% (29.5 % contribution to inflation)
b. Milk and other dairy products, -11.2% (28.5 % contribution to inflation)
c. Cereals and cereal products, -2.0% (26.3 % contribution to inflation)
(SGD) ENGR. JOHNNY F. SOLIS
Chief Statistical Specialist
Source: Philippine Statistics Authority, Retail Price Survey of Commodities
| Attachment | Size |
|---|---|
|
|
298.07 KB |
|
|
154.45 KB |