

Release Date :
Reference Number :
2022-020
Table A. Year-on-Year Inflation Rates: Philippines, MIMAROPA, and the City of Puerto Princesa All Items, In Percent (2018=100)
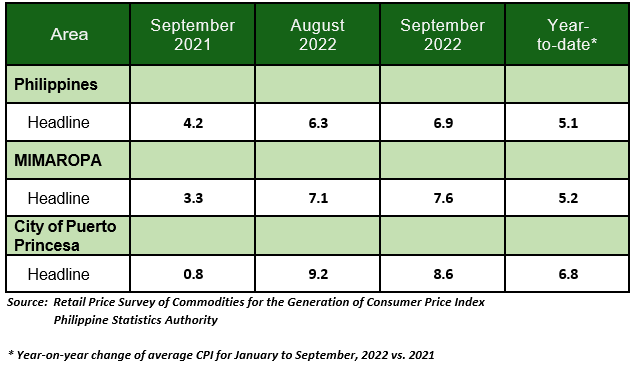
City of Puerto Princesa
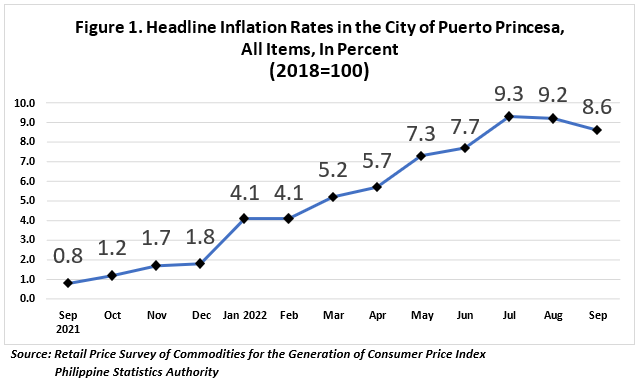
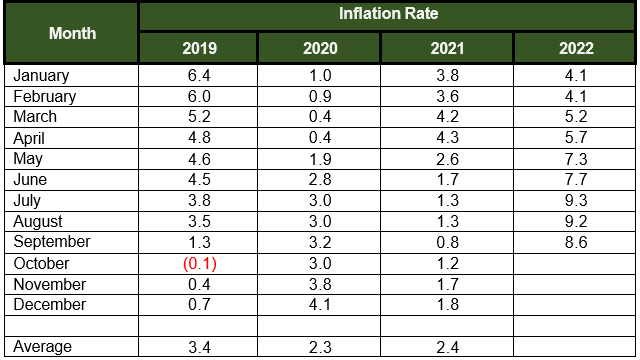
The headline inflation in the City of Puerto Princesa continued to ease as it moved to 8.6 percent in September 2022, from 9.2 percent in August 2022. The average inflation for the first nine months of the year stood at 6.8 percent. (Table A and Figure 1)
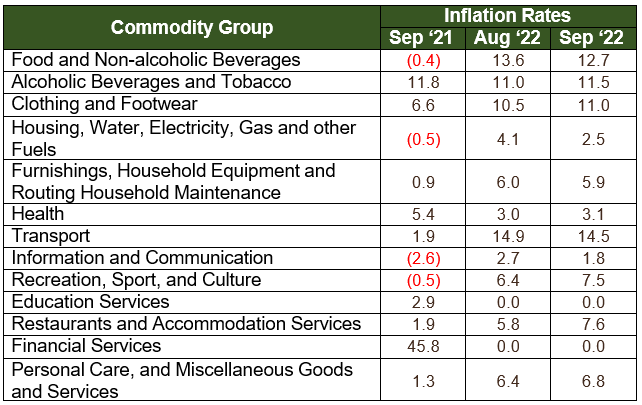
The main cause of the downtrend was the lower index for housing, water, electricity, gas and other fuels at 2.5 percent, from 4.1 percent from the previous month. Food and non-alcoholic beverages index followed at 12.7 percent, from 13.6 percent in August 2022. Then, Transport at 14.5 percent, from the previously recorded 14.9 percent. (Table B)
The following commodity groups also showed lower indices during the month:
a. Information and communication; 1.8 percent; and
b. Furnishings, household equipment and routing household maintenance, 5.9 percent.
On the other hand, the following commodity groups exhibited higher indices for this month:
a. Restaurant and accommodation services, 7.6 percent;
b. Clothing and footwear, 11.0 percent;
c. Personal care and miscellaneous good and services, 6.8 percent;
d. Alcoholic beverages and tobacco, 11.5 percent;
e. Health, 3.1 percent; and
f. Recreation, sport and culture, 7.5 percent.
Meanwhile, Education Services and Financial Services retained their previous month’s rate.
Table B. Year-on-Year Inflation Rates in City of Puerto Princesa, All Items, In Percent (2018=100)
Food index for September 2022 was posted at 13.3 percent, lower than its previous month’s value of 14.4 percent. In September 2021, the food index was lower, at -0.7 percent (Table C).
Commodity groups which had the highest contribution for the decline was Fish and other seafood, at 20.0 percent, followed by Rice, at 4.9 percent and Fruits and Nuts, at 13.1 percent.
Lower growth rates were also observed in the following food indices for September 2022:
a. Sugar, confectionery and desserts, 31.6 percent; and
b. Vegetables, tubers, plantains, cooking bananas and pulses, 9.2 percent.
On the other hand, indices of the following commodity groups that accelerated for the month of September 2022 are as follows:
a. Flour, Bread and Other Bakery Products, Pasta Products, And Other Cereals, 13.4 percent
b. Milk, other dairy products and eggs, 7.7 percent;
c. Ready-made food and other food products n.e.c., 8.6 percent;
d. Oils and fats, 17.6 percent; and
e. Corn, -1.7 percent.
On the other hand, Meat and other parts of slaughtered land animals retained its previous value at 23.9 percent.
Table C. Year-on-Year Inflation Rates in City of Puerto Princesa, By Food Group, In Percent (2018=100)
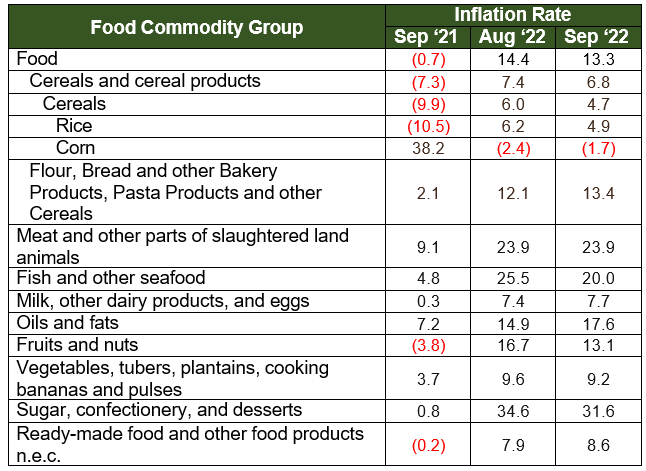
Table D. Year-on-Year Inflation Rates in City of Puerto Princesa, All Items, In Percent January 2019 – September 2022 (2018=100)
| Attachment | Size |
|---|---|
|
|
176.87 KB |