

Release Date :
Reference Number :
2022-018
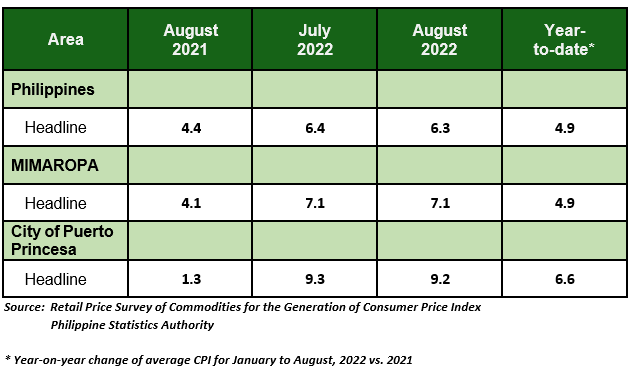
Table A. Year-on-Year Inflation Rates: Philippines, MIMAROPA, and the City of Puerto Princesa All Items, In Percent (2018=100)
City of Puerto Princesa
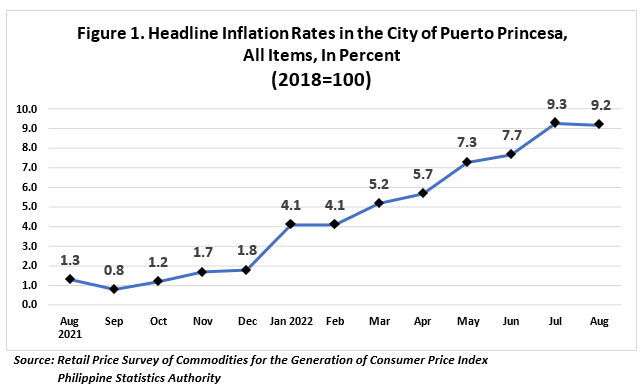
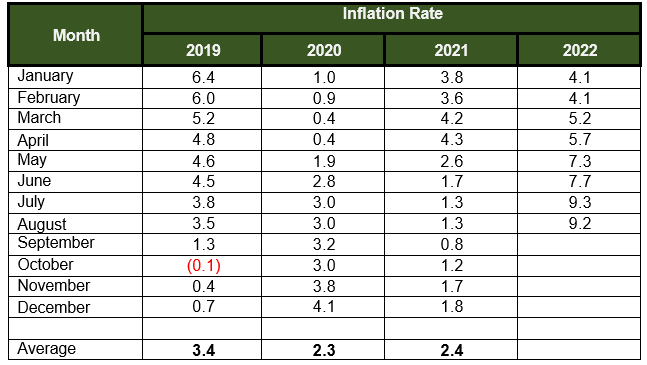
The headline inflation in the City of Puerto Princesa eased to 9.2 percent, after four months of consecutive acceleration. In August 2021, the inflation rate was posted at 1.3 percent. The average inflation for the first eight months of the year stood at 6.6 percent (Table A and Figure 1).
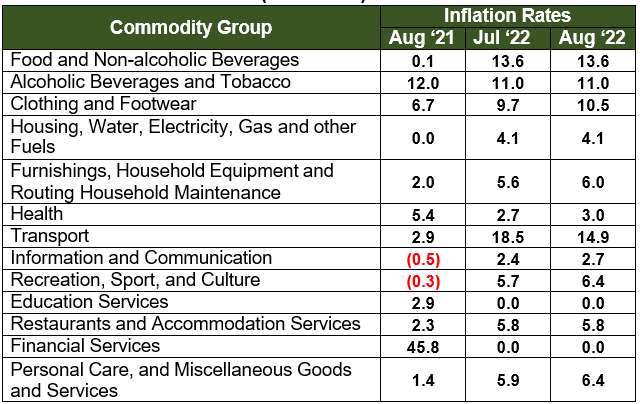
The decrease in the inflation of the city can be solely attributed to index for Transport at 14.9 percent. On the other hand, other commodity groups posted higher indices as follows;
a. Clothing and footwear, 10.5 percent;
b. Recreation, sport, and culture, 6.4 percent;
c. Personal care, and miscellaneous goods and services, 6.4 percent;
d. Furnishings, household equipment, and routine household maintenance, 6.0 percent;
e. Information and communication, 2.7 percent;
f. Health, 3.0 percent.
Meanwhile, the rest of the commodity groups retained their previous month’s rate.
Table B. Year-on-Year Inflation Rates in City of Puerto Princesa, All Items, In Percent (2018=100)
 The food index for August 2022 stood at 14.4 percent, retaining its previous month’s value. In August 2021, the food index was lower at -0.1 percent (Table C).
Higher growth rates were observed in the following food indices for August 2022:
a. Rice, 6.2 percent;
b. Meat and other parts of slaughtered land animals, 23.9 percent;
c. Flour, Bread And Other Bakery Products, Pasta Products, And Other Cereals, 12.1 percent
d. Milk, other dairy products and eggs, 7.4 percent;
e. Ready-made food and other food products n.e.c., 7.9 percent;
f. Sugar, confectionery and desserts, 34.6 percent; and
g. Oils and fats, 14.9 percent.
On the other hand, indices of the following commodity groups that slowed down for the month of July 2022 are as follows:
a. Fish and other seafood, 25.5 percent;
b. Vegetables, tubers, plantains, cooking bananas, pulses, 9.6 percent;
c. Fruits and nuts, 16.7 percent; and
d. Corn, -2.4 percent;
Table C. Year-on-Year Inflation Rates in City of Puerto Princesa, By Food Group, In Percent (2018=100)
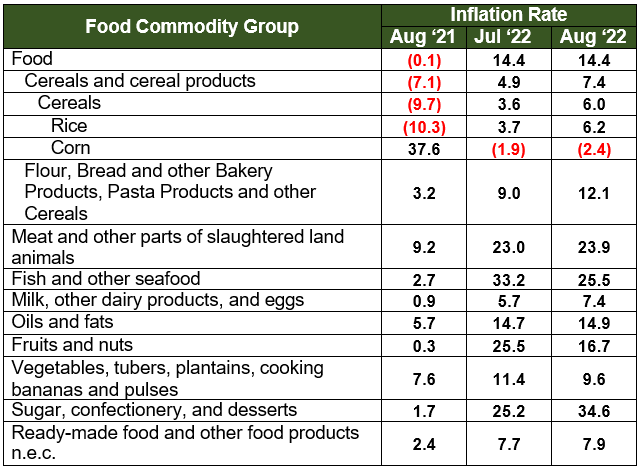
Table D. Year-on-Year Inflation Rates in City of Puerto Princesa, All Items, In Percent January 2019 – August 2022 (2018=100)
| Attachment | Size |
|---|---|
|
|
356.26 KB |