

Release Date :
Reference Number :
2024SR-004
Table A. Year-on-Year Inflation Rates: Philippines,
MIMAROPA, and the City of Puerto Princesa
All Items, In Percent
(2018=100)
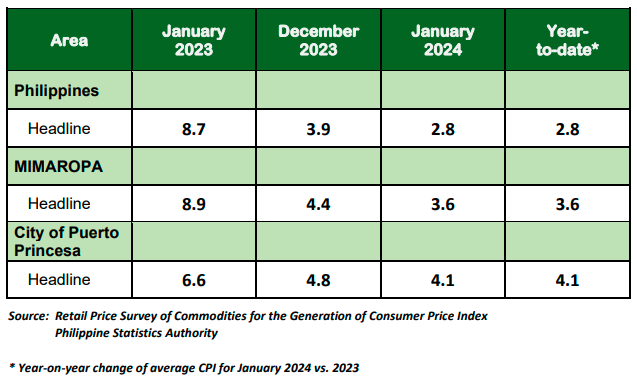
City of Puerto Princesa
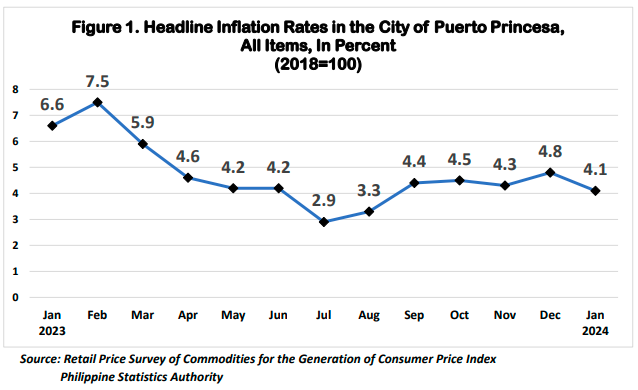
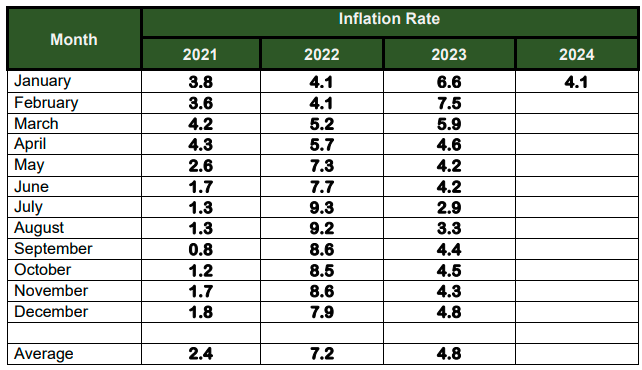
The headline inflation in the City of Puerto Princesa for January 2024 decelerated to 4.1 percent from 4.8 percent in December 2023. In January 2023, the headline inflation was higher, at 6.6 percent. (Table A and Figure 1).
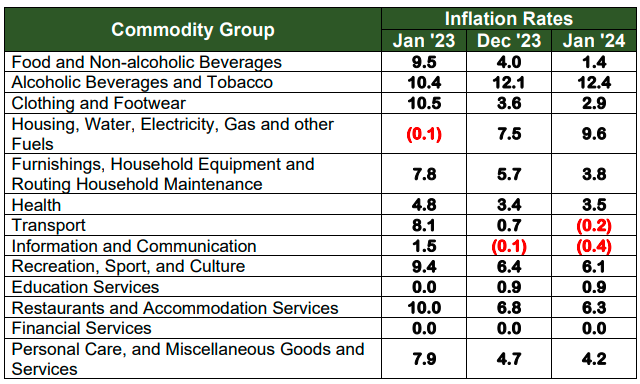
The downtrend in the overall inflation in the city was primarily brought by the lower indices on Food and Non-Alcoholic Beverages posted at 1.4 percent, from 4.0 percent; Transport, with -0.2 percent inflation rate, from 0.7 percent; and Furnishings, Household Equipment and Routine Household Maintenance at 3.8 percent, from 5.7 percent in December 2023.
Also contributing to the slowdown are the slower growth rates observed in the following commodities:
a. Restaurants and Accommodation Services at 6.3 percent, from 6.8 percent;
b. Clothing and Footwear at 2.9 percent, from 3.6 percent;
c. Personal Care, and Miscellaneous Goods and Services, at 4.2 percent, from 4.7 percent;
d. Information and Communication, at -0.4 percent, from -0.1 percent; and
e. Recreation Sport and Culture, at 6.1 percent, from 6.4 percent.
On the contrary, the following commodity groups registered higher growth rates:
a. Housing, Water, Electricity, Gas and Other Fuels, at 9.6 percent from 7.5 percent;
b. Alcoholic Beverages and Tobacco, at 12.4 percent, from 12.1 percent; and
c. Health, at 3.5 percent, from 3.4 percent.
Meanwhile, Education Services and Financial Services remained at 0.9 percent and 0.0 percent, respectively.
Table B. Year-on-Year Inflation Rates in the City of Puerto Princesa,
All Items, In Percent
(2018=100)
Food inflation in January 2024 decreased further to 1.1 percent from 3.9 percent in the previous month. In January 2023, the food index was higher at 9.5 percent inflation rate. (Table C)
The main drivers for the downtrend in food inflation were the indices on Vegetables, Tubers, Plantains, Cooking Bananas, and Pulses posted at -19.7 percent, from -8.4 percent; Fish and Other Seafood, at -1.2 percent from 4.4 percent and Milk, Other Dairy Products and Eggs, at 5.0 percent from 6.8 percent in December 2023.
Furthermore, lower growth rates were also observed in the following commodity groups:
a. Meat and Other Parts of Slaughtered Land Animals, -0.6 percent from -0.1 percent;
b. Flour, Bread and Other Bakery Products, Pasta Products, and Other Cereals, 0.4 percent from 1.3 percent;
c. Fruits and Nuts, -2.4 percent from -0.8 percent; and
d. Sugar, Confectionery, and Desserts, -1.4 percent from -0.5 percent; and
e. Rice, 13.6 percent from 13.7 percent.
In contrast, higher inflation rates were observed in Oils and Fats, at -5.0 percent from -6.6 percent, and Corn, at 14.6 percent from 13.4 percent.
Meanwhile, Ready-made Food and Other Food Products n.e.c. retained its previous month’s inflation rate of 2.8 percent.
Table C. Year-on-Year Inflation Rates in City of Puerto Princesa,
By Food Group, In Percent
(2018=100)
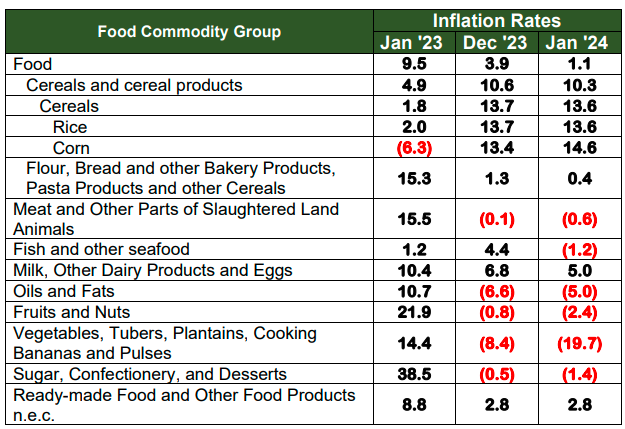
Table D. Year-on-Year Inflation Rates in City of Puerto Princesa,
All Items, In Percent
January 2021 – January 2024
(2018=100)
(SGD) MARIA LALAINE M. RODRIGUEZ
Chief Statistical Specialist
| Attachment | Size |
|---|---|
|
|
361.86 KB |