

Release Date :
Reference Number :
P51-SR2023-008
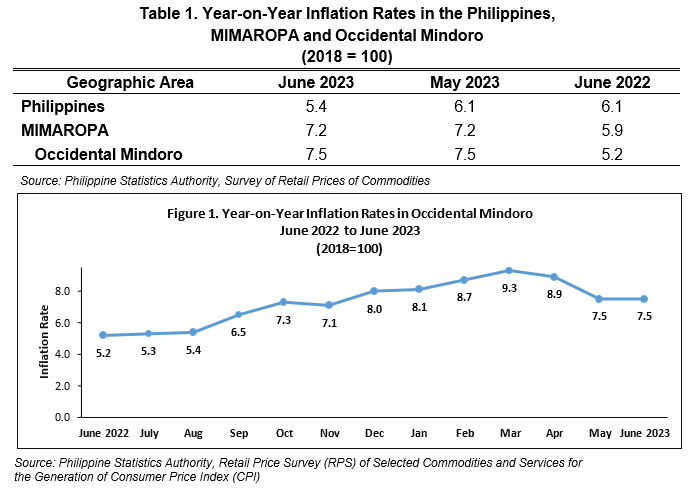
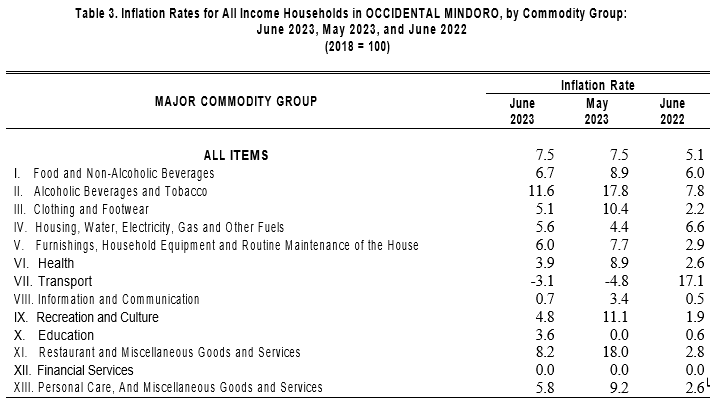
In June 2023, inflation in Occidental Mindoro retained at 7.5 percent from 7.5 percent in May 2023, which is higher than the inflation rate of 5.2 percent in June 2022. Similarly, inflation in MIMAROPA remained unchanged from May to June 2023, with 7.2 percent. In May 2022, the inflation rate in the region was 5.9 percent.
Inflation Rate by Commodity Group
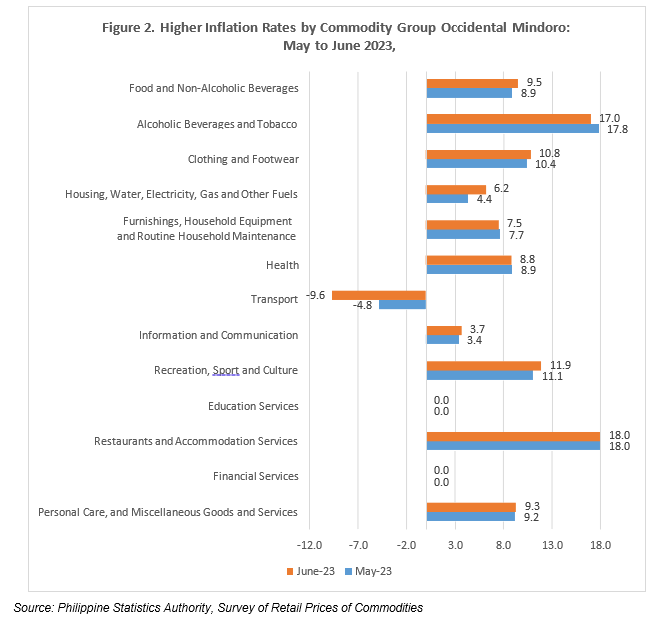
In June 2023, lower gains were observed in the inflation rates of Alcoholic Beverages and Tobacco; Furnishings, Household Equipment, and Routine Household Maintenance; Health; and Transport. On the other hand, six (6) commodity groups showed higher inflation rates. Education services: Restaurant and Accommodation services and financial services remained unchanged in terms of inflation rate compared to May 2023
Inflation Rate by Food Group
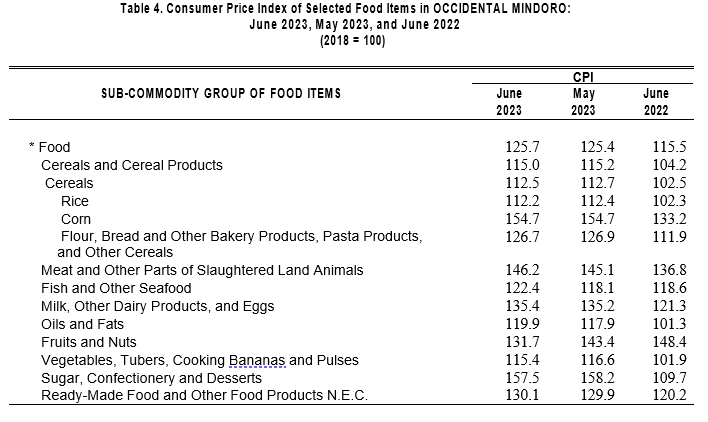
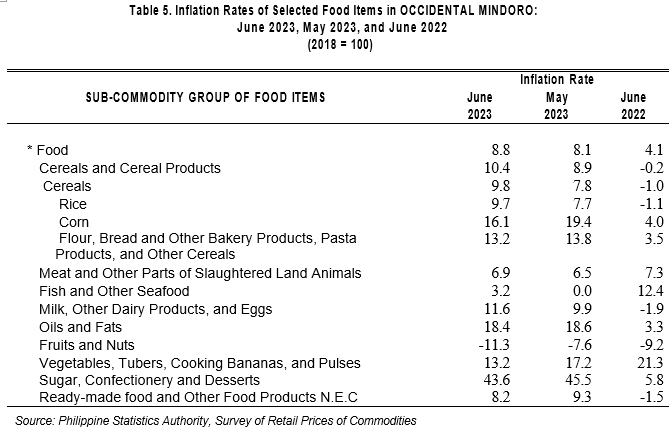
The inflation rate for the food index in the province accelerated to 8.8 percent in June 2023 from 8.1 in May 2023 In June 2022, the inflation rate for the food index in the province was recorded at 4.1 percent.
The annual indices for food commodities with the highest contribution to the uptrend of the food index in June 2023 in the province are Rice, with a incline of 9.7 percent, Meat and other parts of slaughtered land animals showed an incline of 6.9 percent, Fish and other seafood with a rise of 3.2 percent while Milk, other dairy products and eggs had an incline of 11.6 percent. These indices indicate faster year-on- year growth rates for the food group.
Additionally, seven of eleven food commodity groups showed a downward trend (Table 5.) resulting in the overall inflation for the food group to have an upward trend, with 8.8 percent.

Purchasing Power of Peso (PPP)
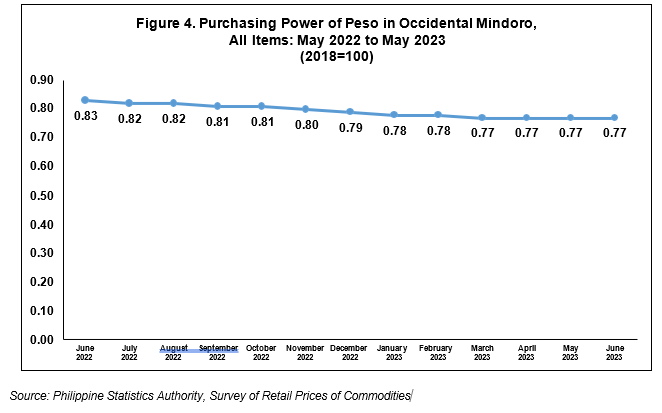
The Purchasing Power of the Peso in Occidental Mindoro in June 2023 remained at Php 0.77. This figure means that a peso in 2018 is only worth 77 centavos in June 2023, while the PPP was registered at 0.83 in June 2022.As a result, the amount of goods that can presently be purchased by consumers is lower compared to when the PPP was higher.

Technical Notes
What is Consumer Price Index (CPI)?
The CPI is an indicator of the change in the average retail prices of a fixed basket of goods and services commonly purchased by households relative to a base year.
What are the uses of CPI?
The CPI is most widely used in the calculation of the inflation rate and purchasing power of the peso. It is a major statistical series used for economic analysis and as a monitoring indicator of government economic policy.
How is the CPI computed?
The CPI is computed using the weighted arithmetic mean of price relatives, a variant of the Laspeyres formula with fixed base year period weights. In computing the CPI, the formula is
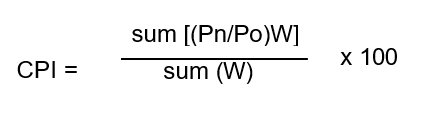
where:
Pn = currentprice
Po = base period price W = PoQo = weights
Base Period - a reference date or simply a convenient benchmark to which a continuous series of index numbers can be related. The base periodis year and the index is taken as equal to 100. The present series uses 2012 as the base year.
Market Basket -selected sample of the varieties of goods purchased by consumption and services availed by households in the country to represent the composite price behavior of all goods and services purchased by consumers.
Weighting System - a desirable system that considers the relevance of the components of the index. For the CPI, the weighting pattern uses the expenditures on various consumer items purchased by households as a proportion to total expenditure.
What is Inflation Rate?
Inflation rate is the annual rate of change or the year-on-year change of the CPI expressed in percent. That is,
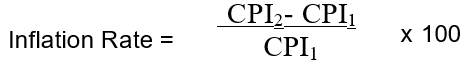
where:
CPI1 - is the CPI in the Previous period
CPI2 - is the CPI in the Current period
What is Purchasing Power of the Peso (PPP)?
The PPP is a measure of the real value of the peso in a give period relative to a chosen reference period. It is computed as the reciprocal of the CPI and multiplying the result by 100. That is,
| Attachment | Size |
|---|---|
|
|
459.63 KB |