

Release Date :
Reference Number :
2025-SR-11
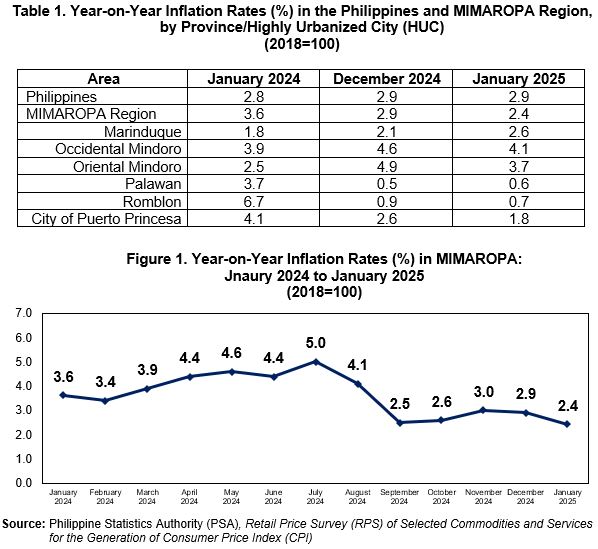
The headline inflation rate at the regional level further decelerated to 2.4 percent in January 2025, from the 2.9 percent in the previous month. In the same reference month of the previous year, the index posted at 3.6 percent. The main contributors to the downtrend of average inflation for all income households were housing, water, electricity, gas and other fuels (1.5 percent inflation); food and non-alcoholic beverages (3.1 percent inflation), and health (1.4 percent inflation).
INFLATION RATE BY COMMODITY GROUP
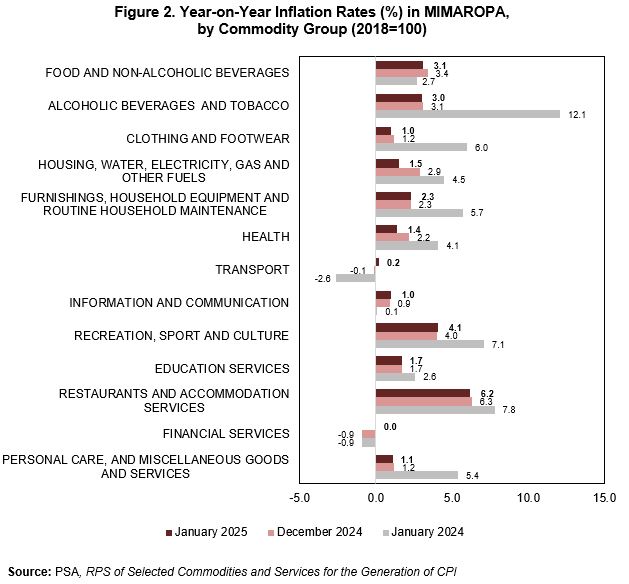
Likewise, the following commodity groups showed a slowdown in the average inflation for the month of January 2025:
• Alcoholic Beverages and Tobacco (3.0% inflation)
• Clothing and Footwear (1.0% inflation)
• Restaurants and Accommodation Services (6.2% inflation), and
• Personal Care and Miscellaneous Goods and Services (1.1% inflation).
On the other hand, the following commodity groups exhibited a higher annual gain in the average inflation for the month of January 2025:
• Information and Communication (1.0% inflation) and
• Recreation, Sport and Culture (4.1% inflation).
Meanwhile, Transport registered a 0.2 percent inflation in January 2025, from the negative inflation in the previous month. The commodity groups of Education Services (1.7% inflation), and Furnishings, Household Equipment and Routine Household Maintenance (2.3% inflation) retained their previous month’s inflation rate.
INFLATION RATE BY FOOD GROUP
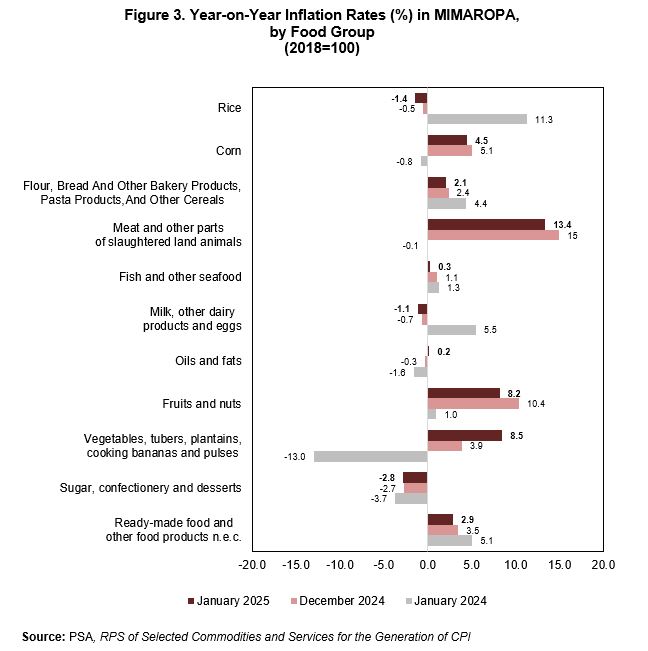
The region’s food index decelerated to 3.2 percent in January 2025, from 3.5 percent in the previous month. Additionally, the food inflation rate was higher by 0.6 percentage point, relative to January 2024. Meanwhile, the downtrend in the food index was mainly attributed to rice (-1.4% inflation), meat and other parts of slaughtered land animals (13.4% inflation), and fish and other seafood (0.3% inflation).
Additionally, the indices of the following food items were lower compared to the annual rates from the previous month: corn (4.5% inflation); flour, bread and other bakery products, pasta products, and other cereals (2.1% inflation); milk, other dairy products and eggs, (-1.1% inflation) fruits and nuts (8.2% inflation); sugar, confectionery and desserts (-2.8% inflation); and ready-made food and other food products not elsewhere classified (2.9% inflation).
Only the inflation of vegetables, tubers, plantains, cooking bananas and pulses had a faster growth in January 2025, while oils and fats registered a 0.2 percent inflation from the -0.3 percent decline in the previous month.
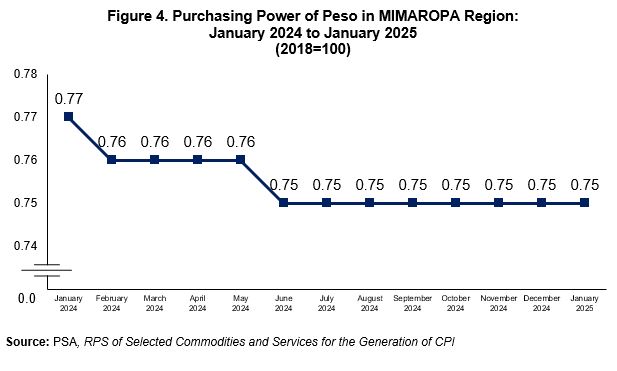
PURCHASING POWER OF PESO
The purchasing power of Peso (PPP) in the MIMAROPA Region retained at Php 0.75 in January 2025. The PPP registered at Php 0.77 in the same month of the previous year. As a result, the amount of goods that can be presently purchased by consumers was fewer compared to when the PPP was higher.
(SGD) LENI R. RIOFLORIDO
Regional Director
MLLM / OHG / APAR
| Attachment | Size |
|---|---|
|
|
2.07 MB |