

Secondary/high school education industry group had the most number of establishments in the education section
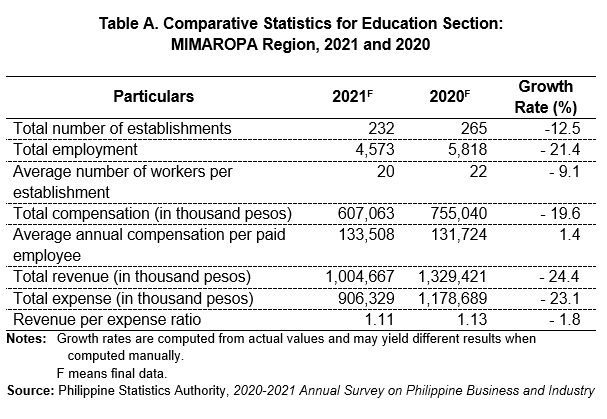
The results of the 2021 Annual Survey of Philippine Business and Industry (ASPBI) showed that a total of 232 establishments in the formal sector of the economy were engaged in education activities. This indicates a decrease of 12.5 percent from the 265 establishments reported in 2020. (Table A)
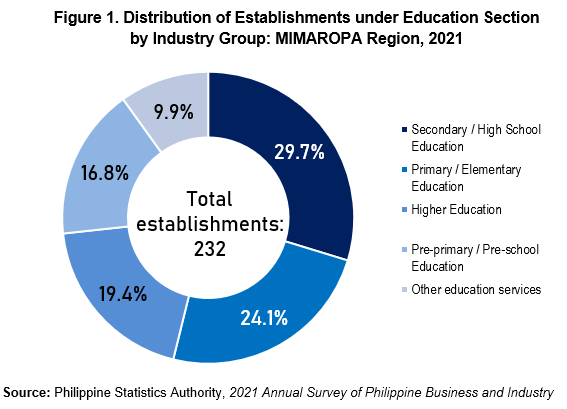
Among industry groups, secondary/high school education recorded the highest number of 69 establishments (29.7%). This was followed by primary/elementary education with 56 establishments (24.1%). On the other hand, other education services recorded the least number of 23 establishments (9.9%). (Figure 1 and Table 1)
Higher education industry group employed the highest number of workers
The total employment in the education section of the MIMAROPA Region was recorded at 4,573 workers as of 15 November 2021. This indicates a decrease of 21.4 percent from the 5,818 workers reported on the same date in 2020. (Table A)
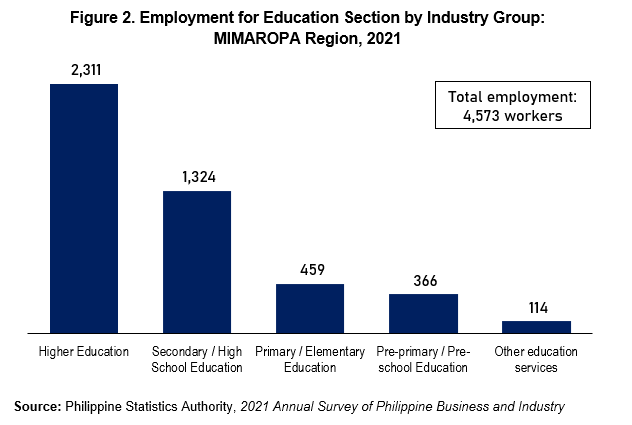
Among industry groups, higher education employed the highest number of 2,311 workers (50.5%). Secondary/high school education ranked second with 1,324 workers (29.0%). On the other hand, other education services employed the least number of 114 workers (2.5%). (Figure 2)
The education section recorded an average of 20 workers per establishment in 2021. This represents a 9.1 percent decline from the reported 22 workers per establishment in the previous year. (Table A)
Among industry groups, higher education had the highest average employment of 51 workers per establishment. Meanwhile, secondary/high school education and pre-primary/pre-school education followed with an average employment of 19 workers and nine (9) workers per establishment, respectively. (Table 2)
Higher education industry group paid the highest average annual compensation per paid employee
In 2021, the total compensation paid by the section to its employees amounted to PhP 607.06 million. This translates to an average annual compensation of PhP 133,508 per paid employee, which indicates a 1.4 percent increase from the recorded average annual pay of PhP 131,724 per paid employee in 2020. (Table A)
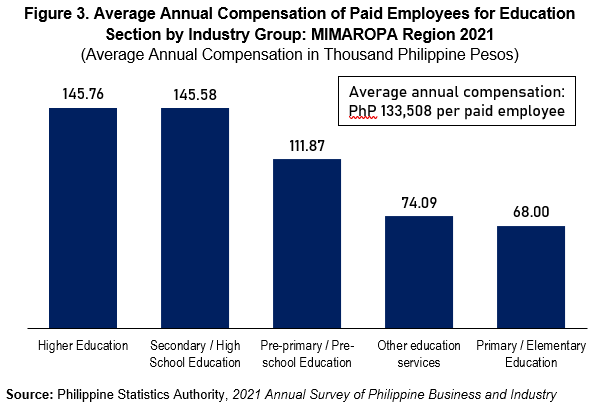
By industry group, employees from higher education received the highest average annual compensation of PhP 145,762 per paid employee in 2021. This was followed by secondary/high school and pre-primary/pre-school education industry groups with average annual compensation per paid employee of PhP 145,584 and PhP 111,871, respectively. (Figure 3 and Table 2)
Higher education industry group contributed the major share to the total revenue and total expense
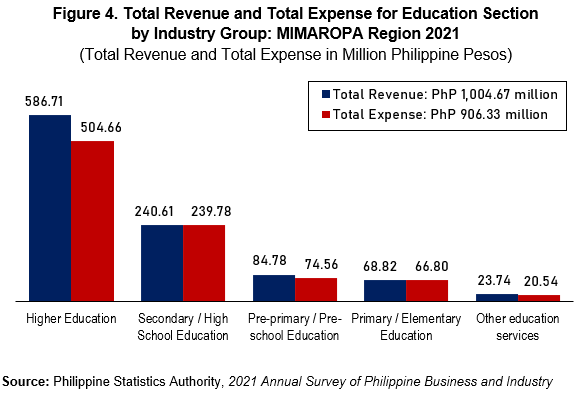
The total revenue generated by the education section in 2021 reached PhP 1,004.67 million, indicating a decrease of 24.4 percent from the PhP 1,329.42 million reported revenue in 2020. On the other hand, the total expense incurred by the section amounted to PhP 906.33 million in 2021, which shows a 23.1 decrease from the PhP 1,178.69 million total expense posted in 2020. (Figure 4 and Table A)
By industry groups, higher education had the highest share to total revenue with PhP 586.71 million (58.4%) in 2021. Secondary/high school and pre-primary/pre-school education followed with a corresponding total revenue of PhP 240.61 million (23.9%) and PhP 84.78 million (8.4%), respectively. (Figure 4 and Table 1)
In terms of expenses, the top spender was higher education industry group with PhP 504.66 million. This translates to a 55.7 percent share to the education section’s total expenses. Secondary/high school and pre-primary/pre-school education came next with incurred total expenses of PhP 239.78 million (26.5%) and PhP 74.56 million (8.2%), respectively. (Figure 4 and Table 1)
In 2021, the revenue per peso expense ratio of the education section was recorded at 1.11, which reflects a decrease of 1.8 percent from the recorded 1.13 revenue per expense ratio in 2020. This indicates that for every peso spent in 2021, the section generated a corresponding revenue of PhP 1.11. (Table A and Table 2)
By industry group, both higher education and other education services registered the highest revenue per peso expense ratio of 1.16. Pre-primary/pre-school education came second with a recorded revenue per peso expense ratio of 1.14. While primary/elementary education ranked third with revenue per peso expense ratio of 1.03. (Table 2)
(SGD) LENI R. RIOFLORIDO
Regional Director
MLLM / OHG / JPR