

Table 1. Year-on-Year Inflation Rates: Philippines, MIMAROPA, and Romblon: All Items (2018=100)
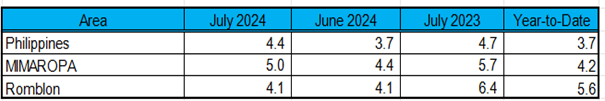
Source: Philippine Statistics Authority, Retail Price Survey of Commodities
The headline inflation rate of Romblon remained at 4.1 percent in July 2024, the same rate recorded in the previous month. Compared to the previous year, the inflation rate is lower than the registered 6.4 percent in July 2023.
The steady inflation rate for the month indicates that no changes in the overall year-on-year rate of change of prices of goods and services in the province in July 2024. An acceleration in the inflation rate of some commodity groups in July 2024 was observed such as:
• Housing, Water, Electricity, Gas and Other Fuels, 4.1% (17.7% share to overall inflation)
• Health, 2.0% (1.3% share to overall inflation)
• Information and Communication, -0.2% (-0.1% share to overall inflation)
• Personal Care, and Miscellaneous Goods and Services, 1.5% (1.8% share to overall inflation)
On the other hand, there was an observed slowing down of the year-on-year growth rate in the indices of the commodity group such as:
• Alcoholic Beverages and Tobacco, 6.0% (2.8% share to overall inflation)
• Furnishing, Household Equipment, and Routine Maintenance of the House, 3.0% (2.9% share to overall inflation)
• Transportation, -0.7% (-1.3% share to overall inflation)
• Restaurant & Accommodation Services, 7.2%(8.7% share to overall inflation)
On the other hand, Food and Non-alcoholic Beverages (5.4%), Clothing and Footwear (2.0%), Recreation, Sports and Culture (3.2%), Education Services (2.6%) and Financial Services (-11.1%) remained at their previous month’s rate.
In the past 12 months, the highest inflation rate was observed in the month of September 2023 computed at 9.7 percent while the lowest was observed in June and July 2024 at 4.1 percent (Figure 1).
Figure 1. One-Year Monthly Inflation Rate of Romblon: August 2023 – July 2024
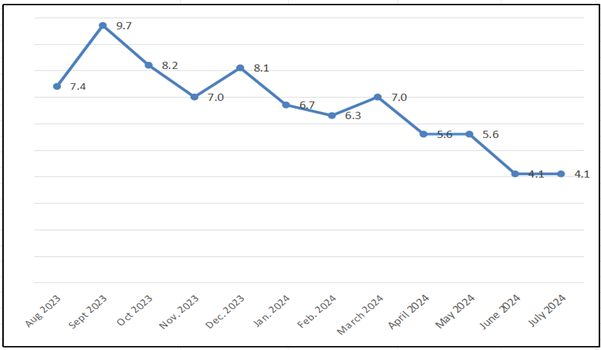
Source: Philippine Statistics Authority, Retail Price Survey of Commodities
Table 2 shows that the month-on-month price index for all items in the province increased by 0.2 percent (131.5 to 131.7). It also shows that House, Water, Electricity, Gas and Other Fuels registered the highest increment with reference to the price situation in the previous month, increased by 0.6 percent (117.1 to 117.8). Other commodity group with increased observed price situation includes Transportation with 0.3 percent (135.8 to 136.2), Clothing and Footwear with 0.2 percent (125.4 to 125.6), Health with 0.2 percent (125.9 to 126.1), Personal Care and Miscellaneous Goods and Services with 0.2 percent (121.2 to 121.4), and Food and Non-alcoholic Beverages with 0.1 percent (134.9 to 135.0).
Meanwhile, there is no observed month-on-month changes in average prices of Information and Communication, Recreation, Sports and Culture, Education Services, Restaurant and Accommodation Services, and Financial Services.
The average monthly CPI for all income households in the province in July 2024 was recorded at 131.7, increased by 4.1 percent from the price level on the same month of the past year (126.5).
Table 2. Consumer Price Index by Commodity Group for All Income Households (2018=100)
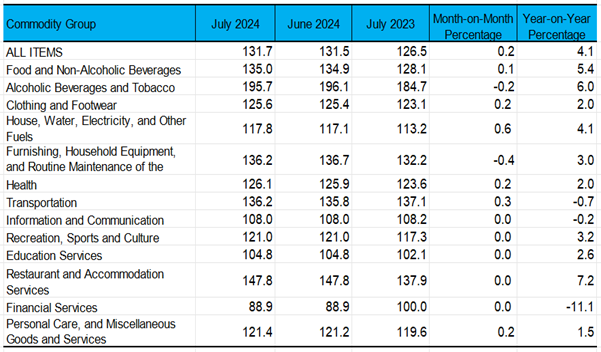
Source: Philippine Statistics Authority, Retail Price Survey of Commodities
Meanwhile, Figure 2 shows the Consumer Price Indices of different commodity groups in July 2024. The commodity group of Alcoholic Beverages and Tobacco registered 195.7, the highest value of the CPI in the province during the period. It was followed by Restaurant and Accommodation Services (147.8) and Furnishing, Household Equipment, and Routine Maintenance of the House (136.2) and Transport (136.2).
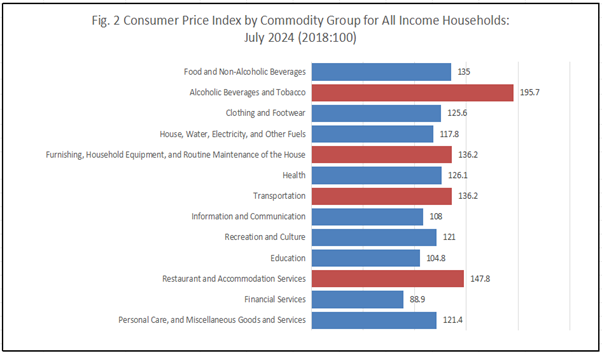
Source: Philippine Statistics Authority, Retail Price Survey of Commodities
Purchasing Power of Peso
CPI is further used in the computation of Purchasing Power of Peso (PPP). PPP measures the “true” value of money using a given base year.
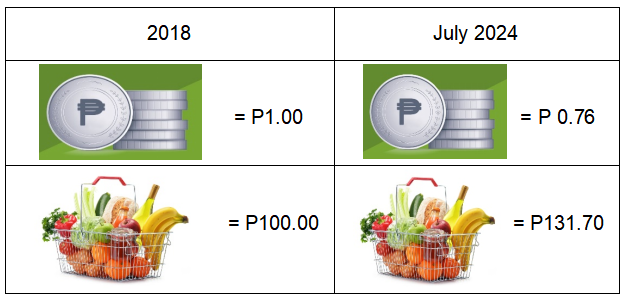
In July 2024, the PPP was calculated to have a value of P0.76 on the average, which means that P1.00 in 2018 is only worth 76 centavos. Also, on the average, an individual needs P131.70, or P31.70 more, to buy the same basket of goods that was worth P100.00 in 2018.
(SGD) JOHNNY F. SOLIS
Chief Statistical Specialist