

Release Date :
Reference Number :
2024-SR-37
A. Health Status of Family Members
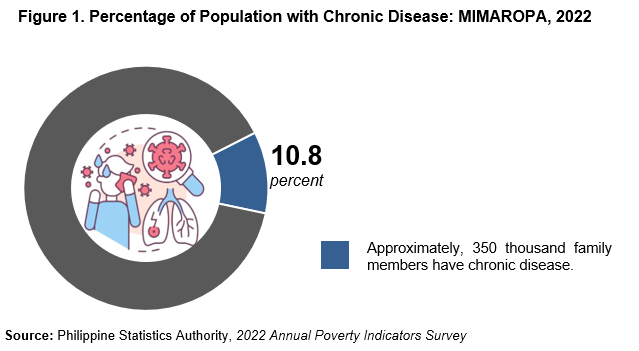
Chronic diseases refer to diseases that have long duration and progress slowly. They also do not end quickly.
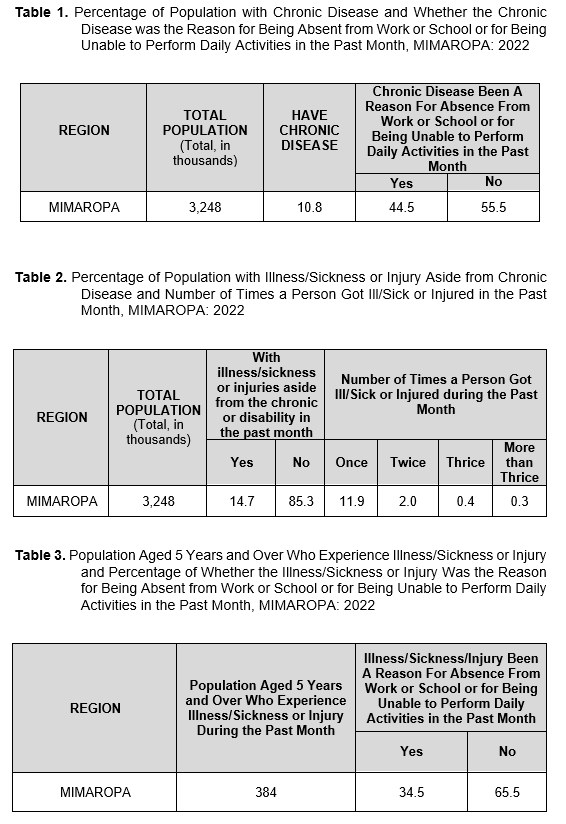
Based on the 2022 APIS, of the 3.2 million population in the MIMAROPA Region, about 10.8 percent or 305 thousand reported that they have chronic disease. Of those family members who have chronic disease, about 44.5 percent were not able to go to work/school or were not able to perform daily activities in the past month. (Figure 1 and Table 1)
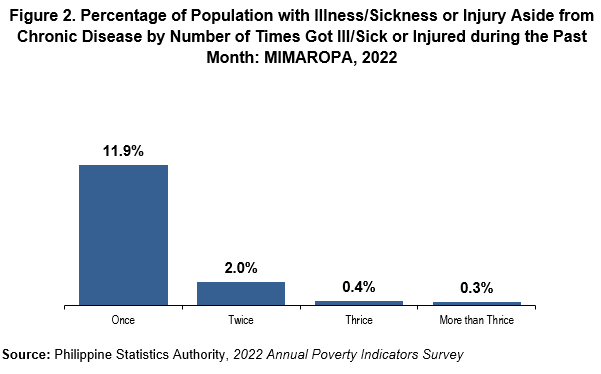
Illness refers to the health condition of a person involving his body or mind due to disease or fatigue. Meanwhile, injured refers to any sustained bodily damages, hurts, or loss by a person on an individual.
In 2022, about 14.7 percent of the total family members in the MIMAROPA Region reported that they got ill/sick or injured aside from having the chronic disease in the past month preceding the survey; that is, from 01 to 30 June 2022. Of those family members who got ill/sick or injured, about 11.9 percent had it once, 2.0 percent had it twice, and less than one percent (0.7%) had it at least thrice. (Figure 2)
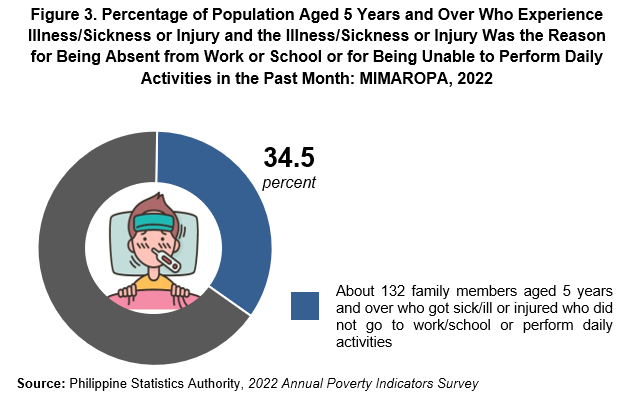
In the MIMAROPA Region, there were 384 family members aged 5 years and over who got ill/sick or injured during the past month. Of these, about 34.5 percent were not able to go to work/school or were not able to perform daily activities. (Figure 3 and Table 3)
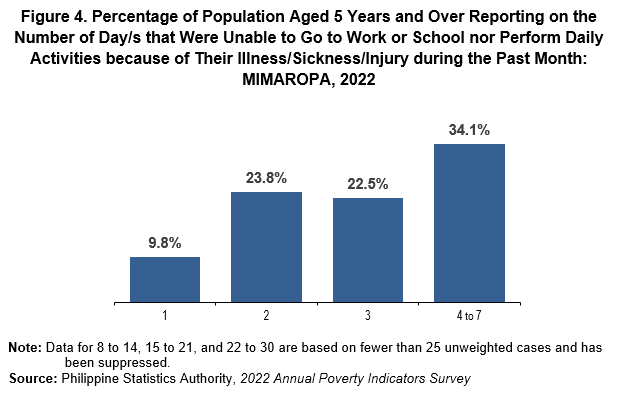
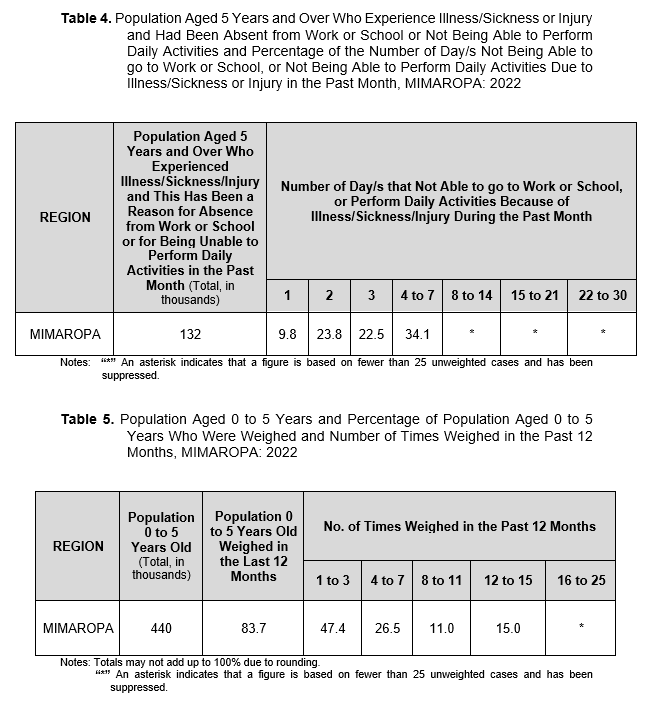
In the MIMAROPA Region, the most common duration in terms of the number of days not being able to go to work or school nor performed daily activities due to illness/sickness or injury in the past month was four to seven days with 34.1 percent. (Figure 4)
B. Operation Timbang of Family Members Aged 0 to 5 Years
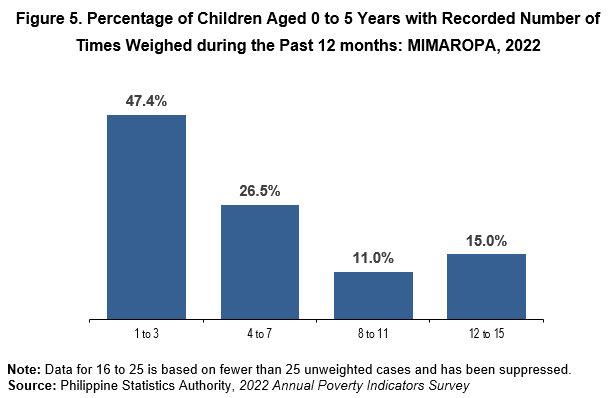
In the MIMAROPA Region, about 83.7 percent children aged 0 to 5 years were weighed in the past 12 months preceding the survey.
Among children aged 0 to 5 years old who were weighed in the past 12 months, 47.4 percent were weighed up to three times, 26.5 percent were weighed four to seven times, 11.0 percent were weighed eight to eleven times, and 15.0 percent were weighed 12 to 15 times. (Figure 5)
(SGD) LENI R. RIOFLORIDO
Regional Director
MLLM / OHG / RRL / RMCB
Technical Notes
The Annual Poverty Indicators Survey (APIS) is a household-based survey to provide information on the different indicators related to poverty that can be used to monitor the poverty situation in the country. The APIS is undertaken during the years when the Family Income and Expenditure Survey (FIES) is not conducted. Moreover, APIS is a rider survey to the July Labor Force Survey (LFS) round.
The 2022 APIS is the fourteenth in a series of poverty indicators survey conducted nationwide since 1998. The APIS is designed to provide estimates for non-income indicators related to poverty and serve as inputs in the Multi-dimensional Poverty Index (MPI) development.
Specifically, it gathers information on indicators that are correlated with poverty in order to determine the percent distribution of families in relation to the following indicators:
a. owner-like possession of house and lot and type of materials for the roof, outer walls, and floor materials of the housing unit;
b. type of toilet and handwashing facility, main source of water supply, and source of drinking water used by the family;
c. ownership of household conveniences;
d. children 6-11 years old enrolled in Grade 1 to Grade 6;
e. children 12-17 years old enrolled in junior high school (Grade 7 to Grade 10);
f. who availed loan/s and its sources;
g. who received and availed selected social protection programs; and
h. access to government services.
The 2022 APIS had a national sample of approximately 44,000 sample households deemed sufficient to provide reliable estimates at the national and regional levels. These sample housing units/households are selected from the 2013 Master Sample (MS) for household-based surveys of the PSA.
The reporting unit is the household, which means that the statistics emanating from this survey will refer to the characteristics of the population residing in private households. Persons who reside in the institutions are not within the scope of the survey.
The data collection of the 2022 APIS ran for 21 days from 08 to 30 July 2022. In this round of the APIS, Computer Aided Personal Interviewing (CAPI) using Tablet devices was utilized during data collection. The statistical researchers visited the sample housing units and interviewed the eligible respondents. The eligible respondent is the household head or the spouse of the head. In the absence of the household head or of his/her spouse, the respondent can be any responsible adult member who can provide reliable answers to questions asked by the survey interviewer about the household and its members.
The 2022 APIS, being a household-based survey, used the 2013 Master Sample (MS) of which 4 replicates equivalent to a total of 42,768 Secondary Sampling Units (SSUs) or sample housing units were selected as samples. Using a two-stage cluster sampling design, Enumeration Areas (EAs)/barangays were selected at the initial sampling stage as the Primary Sampling Units (PSUs), while the housing units within the selected PSUs were selected as the SSUs. Generally, all households within the sample housing unit were also considered as sample households. However, for housing units with more than three (3) households, a maximum of three (3) sample households were randomly selected.
| Attachment | Size |
|---|---|
|
|
2.55 MB |