

Release Date :
Reference Number :
2024-SR-25
Social assistance
Of the 803 thousand families in the MIMAROPA Region, about 24.8 percent or 199.14 thousand were members/beneficiaries of the Regular Conditional Cash Transfer (CCT)—Pantawid Pamilyang Pilipino Program (4Ps), while 1.9 percent were covered by the Modified CCT—4Ps. Moreover, 18.6 percent of families were beneficiaries of Indigent Senior Citizen’s Social Pension (SPISC or SocPen), 2.4 percent received assistance from Malasakit Center, 4.4 percent were beneficiaries of Student Financial Assistance Programs (StuFAP) other than Universal Access to Quality Tertiary Education (UAQTE), 12.1 percent received assistance to individual in crisis situation (AICS), and 4.6 percent received Emergency Shelter Assistance (ESA). (Figure 1)
Figure 1. Percentage of Families Who Availed/Received Benefits/Assistance/ Payments by Type of Social Assistance Programs, MIMAROPA Region: January to June 2022
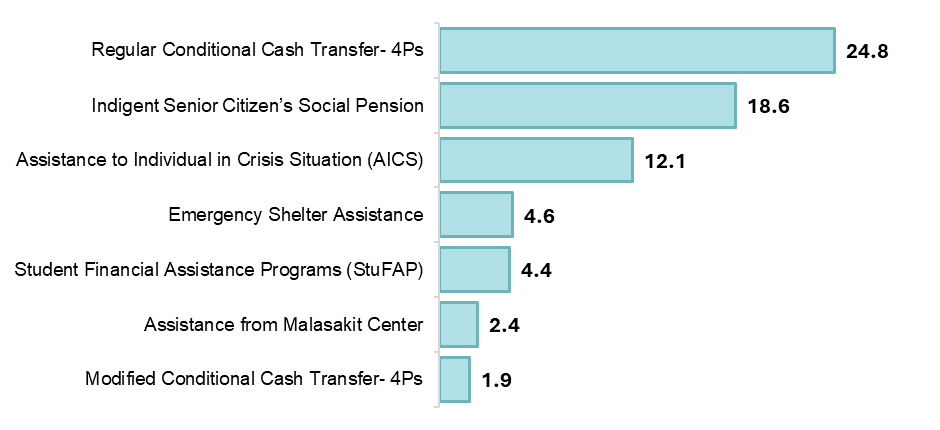
Source: Philippine Statistics Authority, 2022 Annual Poverty Indicators Survey
Feeding programs
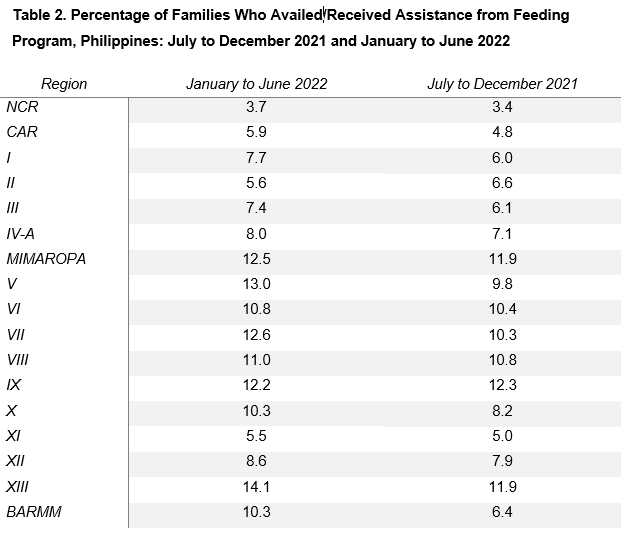
From July to December 2021, the MIMAROPA Region was the second-highest region in terms of families who availed/received benefits/assistance from feeding programs, with about 11.9 percent. This percentage went up to 12.5 percent from January to June 2022 (Figure 2).
Figure 2. Percentage of Families Who Availed/Received Assistance from Feeding Programs, Philippines: July to December 2021 and January to June 2022
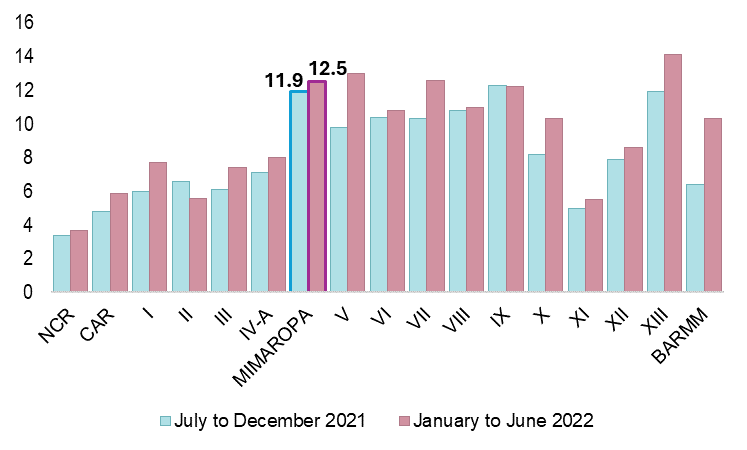
Source: Philippine Statistics Authority, Source: Philippine Statistics Authority,
Social insurance
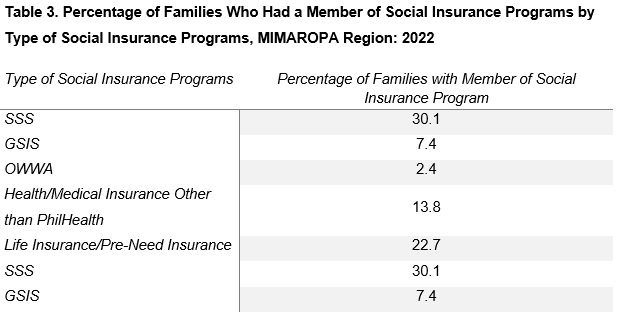
The Social Security System (SSS) stood out as the primary social insurance program among families. About 3 in 10 families (30.1%) had a member/dependent/beneficiary of SSS. This was followed by membership to Life Insurance/Pre-need Insurance (22.7%), Health/Medical Insurance (HMO) other than PhilHealth (13.8%), Government Service Insurance System (GSIS) (7.4%), and Overseas Workers Welfare Administration (OWWA) (2.4%). (Figure 3)
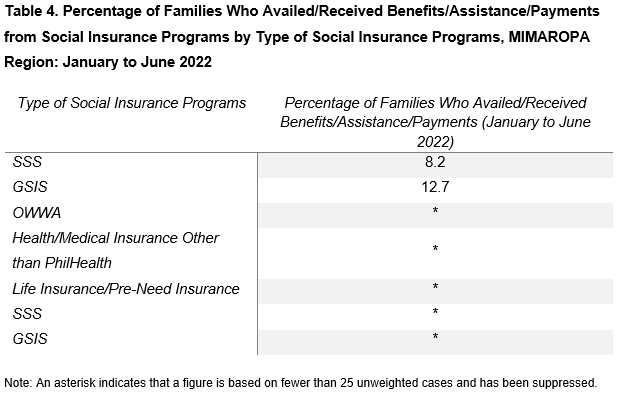
Among the social insurance programs availed from January to June 2022, GSIS was the most utilized which was availed/received by 12.7 percent of families with a member of the said program, followed by SSS with 8.2 percent. (Figure 4)
Figure 3. Percentage of Families Who Had a Member of Social Insurance Program,
by Type of Social Insurance Programs, MIMAROPA Region: 2022
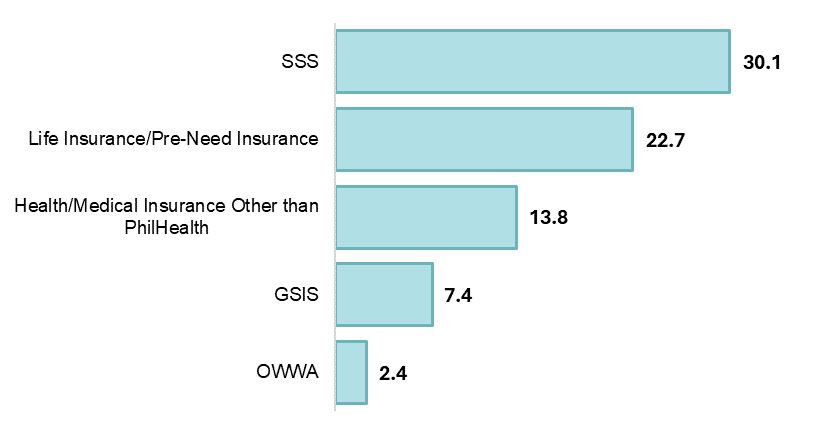
Source: Philippine Statistics Authority, 2022 Annual Poverty Indicators Survey
Figure 4. Percentage of Families Who Availed/Received Benefits/Assistance/ Payments from Social Insurance Programs, by Type of Social Insurance Programs, MIMAROPA Region: January to June 2022
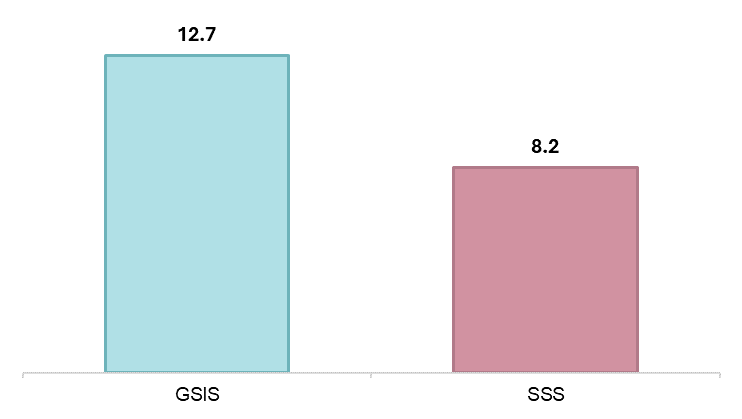
Source: Philippine Statistics Authority, 2022 Annual Poverty Indicators Survey
PhilHealth membership
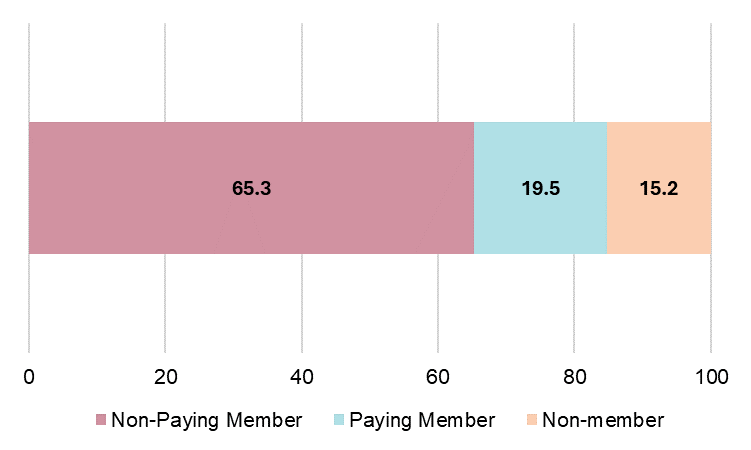
About eight in ten families (84.8%) had at least one member/dependent/beneficiary of PhilHealth. Of these families, 19.5 percent were paying members and 65.3 percent were non-paying members, which can be referred to as indigent member, dependent of indigent member, or is a privately sponsored member. (Figure 5)
Out of the 681 thousand families having at least one member/dependent/beneficiary of PhilHealth, only about 17.03 thousand families (2.5%) availed/received PhilHealth services from January to June 2022.
Figure 5. Percentage of Non-member and Paying and Non-Paying Families With At Least One Member/Dependent/Beneficiary of PhilHealth, MIMAROPA Region: 2022
Source: Philippine Statistics Authority, 2022 Annual Poverty Indicators Survey
Awareness on local child protection unit
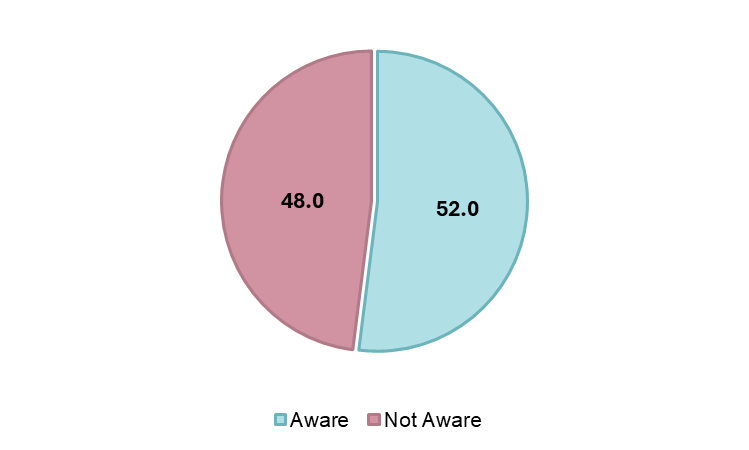
In 2022, 52.0 percent or about 417.56 thousand families were aware of the existing local child protection unit or local social welfare and development office. It is a bit higher than the 51.8 percent average percentage for the whole country. (Figure 6)
Figure 6. Percentage of Families that are Aware of the Existing Local Child Protection Unit/Local Social Welfare and Development, MIMAROPA: 2022
Source: Philippine Statistics Authority, 2022 Annual Poverty Indicators Survey
Disaster preparedness kit
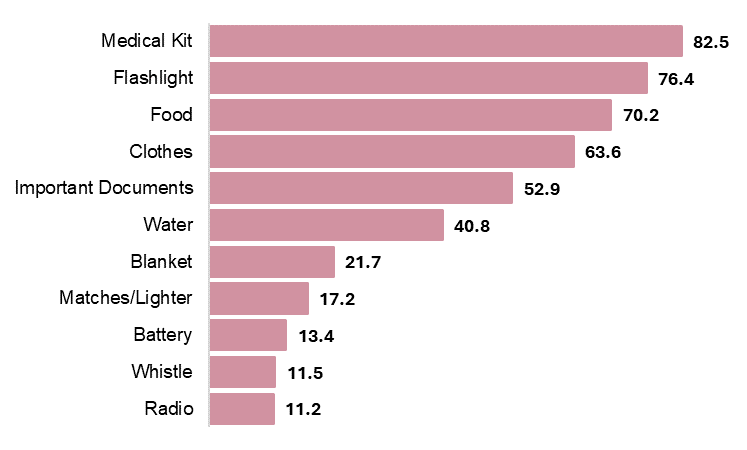
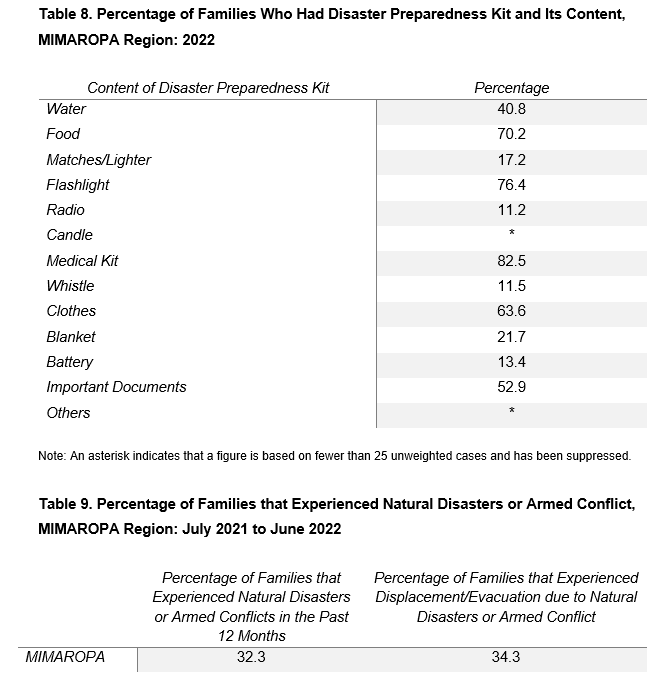
About 16.5 percent or 132.50 thousand families in the MIMAROPA Region had a disaster preparedness kit or supplies kit to grab to go bag in the event of emergency. The most common contents of the kit were medical kit (82.5%), flashlight (76.4%), food (70.2%), clothes (63.6%) and important documents (52.9%). (Figure 7)
Figure 7. Percentage of Content of Disaster Preparedness Kit,
MIMAROPA Region: 2022
Source: Philippine Statistics Authority, 2022 Annual Poverty Indicators Survey
Experienced natural disasters or armed conflict
In the MIMAROPA Region, about 259.37 thousand (32.3%) families experienced natural disasters, such as flooding, storm damage, earthquakes, drought, or armed conflict from July 2021 to June 2022, while approximately 275.43 thousand (34.3%) families experienced displacement or evacuation due to natural disaster or armed conflict.
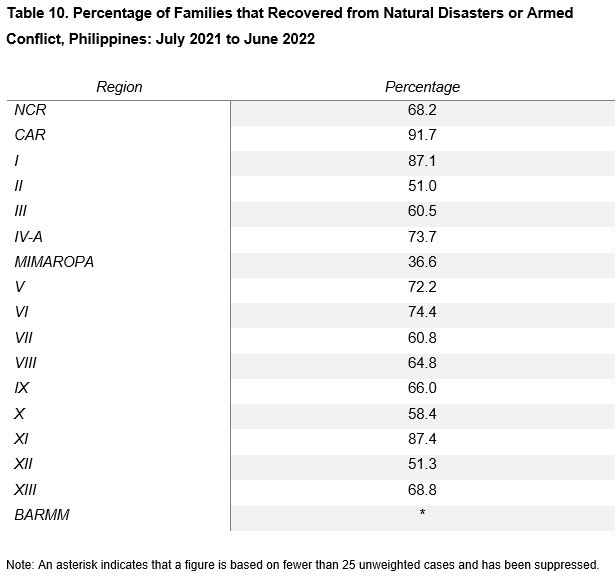
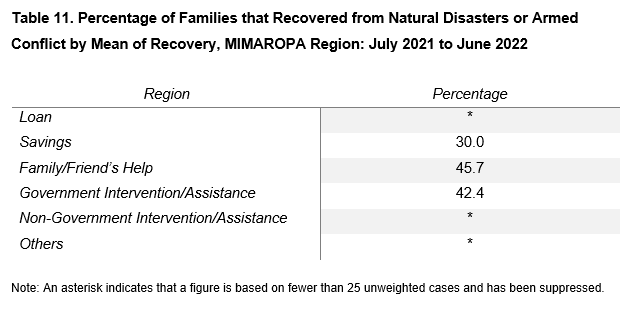
In terms of recovery, the region had the lowest percentage of families who recovered from natural disasters or armed conflicts with 36.6 percent. The most common sources of recovery for these families were assistance from family or friends (45.7%), government intervention or assistance (42.4%), and savings (30.0%). (Figure 8)
Figure 8. Percentage of Families that Recovered from Natural Disasters or Armed Conflict, Philippines: July 2021 to June 2022

Note: An asterisk indicates that a figure is based on fewer than 25 unweighted cases and has been suppressed.
Source: Philippine Statistics Authority, 2022 Annual Poverty Indicators Survey
(SGD) LENI R. RIOFLORIDO
Regional Director
OHG/EVC/LACB
TECHNICAL NOTES
The Annual Poverty Indicators Survey (APIS) is a household-based survey to provide information on the different indicators related to poverty that can be used to monitor the poverty situation in the country. The APIS is undertaken during the years when the Family Income and Expenditure Survey (FIES) is not conducted. Moreover, APIS is a rider survey to the July Labor Force Survey (LFS) round.
The 2022 APIS is the fourteenth in a series of poverty indicators survey conducted nationwide since 1998. The APIS is designed to provide estimates for non-income indicators related to poverty and serve as inputs in the Multi-dimensional Poverty Index (MPI) development.
Specifically, it gathers information on indicators that are correlated with poverty in order to determine the percent distribution of families in relation to the following indicators:
a. owner-like possession of house and lot and type of materials for the roof, outer walls, and floor materials of the housing unit;
b. type of toilet and handwashing facility, main source of water supply, and source of drinking water used by the family;
c. ownership of household conveniences;
d. children 6-11 years old enrolled in Grade 1 to Grade 6;
e. children 12-17 years old enrolled in junior high school (Grade 7 to Grade 10);
f. who availed loan/s and its sources;
g. who received and availed selected social protection programs; and
h. access to government services.
The 2022 APIS had a national sample of approximately 44,000 sample households deemed sufficient to provide reliable estimates at the national and regional levels. These sample housing units/households are selected from the 2013 Master Sample (MS) for household-based surveys of the PSA.
The reporting unit is the household, which means that the statistics emanating from this survey will refer to the characteristics of the population residing in private households. Persons who reside in the institutions are not within the scope of the survey.
The data collection of the 2022 APIS ran for 21 days from 08 to 30 July 2022. In this round of the APIS, Computer Aided Personal Interviewing (CAPI) using Tablet devices was utilized during data collection. The statistical researchers visited the sample housing units and interviewed the eligible respondents. The eligible respondent is the household head or the spouse of the head. In the absence of the household head or of his/her spouse, the respondent can be any responsible adult member who can provide reliable answers to questions asked by the survey interviewer about the household and its members.
The 2022 APIS, being a household-based survey, used the 2013 Master Sample (MS) of which 4 replicates equivalent to a total of 42,768 Secondary Sampling Units (SSUs) or sample housing units were selected as samples. Using a two-stage cluster sampling design, Enumeration Areas (EAs)/barangays were selected at the initial sampling stage as the Primary Sampling Units (PSUs), while the housing units within the selected PSUs were selected as the SSUs. Generally, all households within the sample housing unit were also considered as sample households. However, for housing units with more than three (3) households, a maximum of three (3) sample households were randomly selected.


| Attachment | Size |
|---|---|
|
|
3.97 MB |