

Release Date :
Reference Number :
2024-SR-27
Sixty four percent of the population 15 years old and over in MIMAROPA Region were part of the labor force
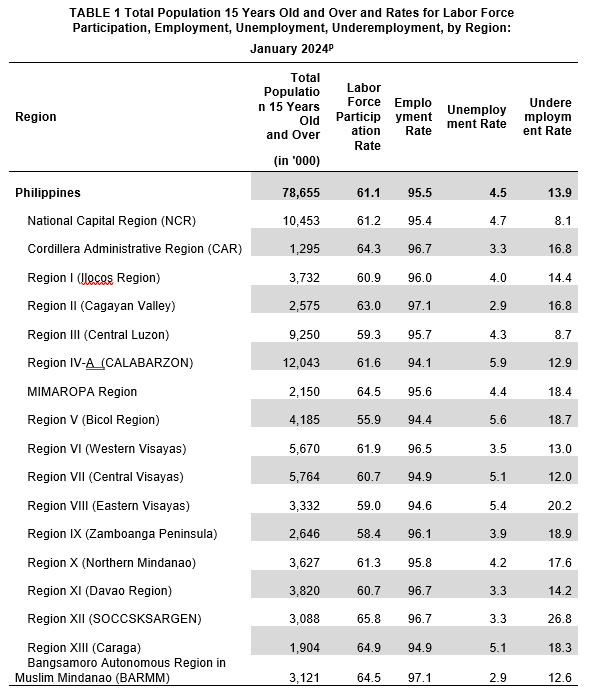
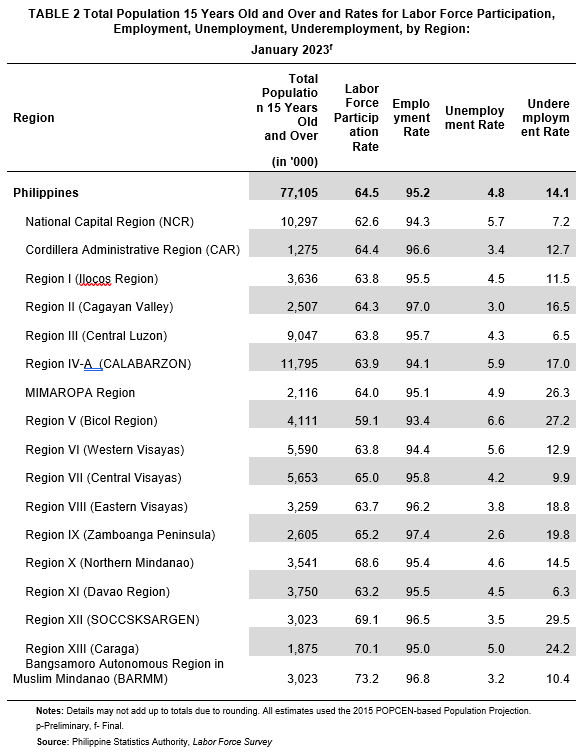
More than three out of five or 64.5 percent of the estimated 2.15 million total population 15 years old and over in the MIMAROPA Region were part of the labor force in January 2024. The level of labor force participation of the working-age population in the MIMAROPA Region increased by 0.5 percentage point, from the previous estimate in January 2023 which recorded only 64.0 percent labor force participation rate (LFPR). The region’s LFPR in January 2024 is 3.4 percentage points higher than the national estimate, which was 61.1 percent.

Source: Philippine Statistics Authority, Labor Force Survey
The region with highest LFPR was Region XII with 65.8 percent while Region V has the lowest LFPR with 55.9 percent for January 2024.
Ninety-five percent of population in MIMAROPA are employed
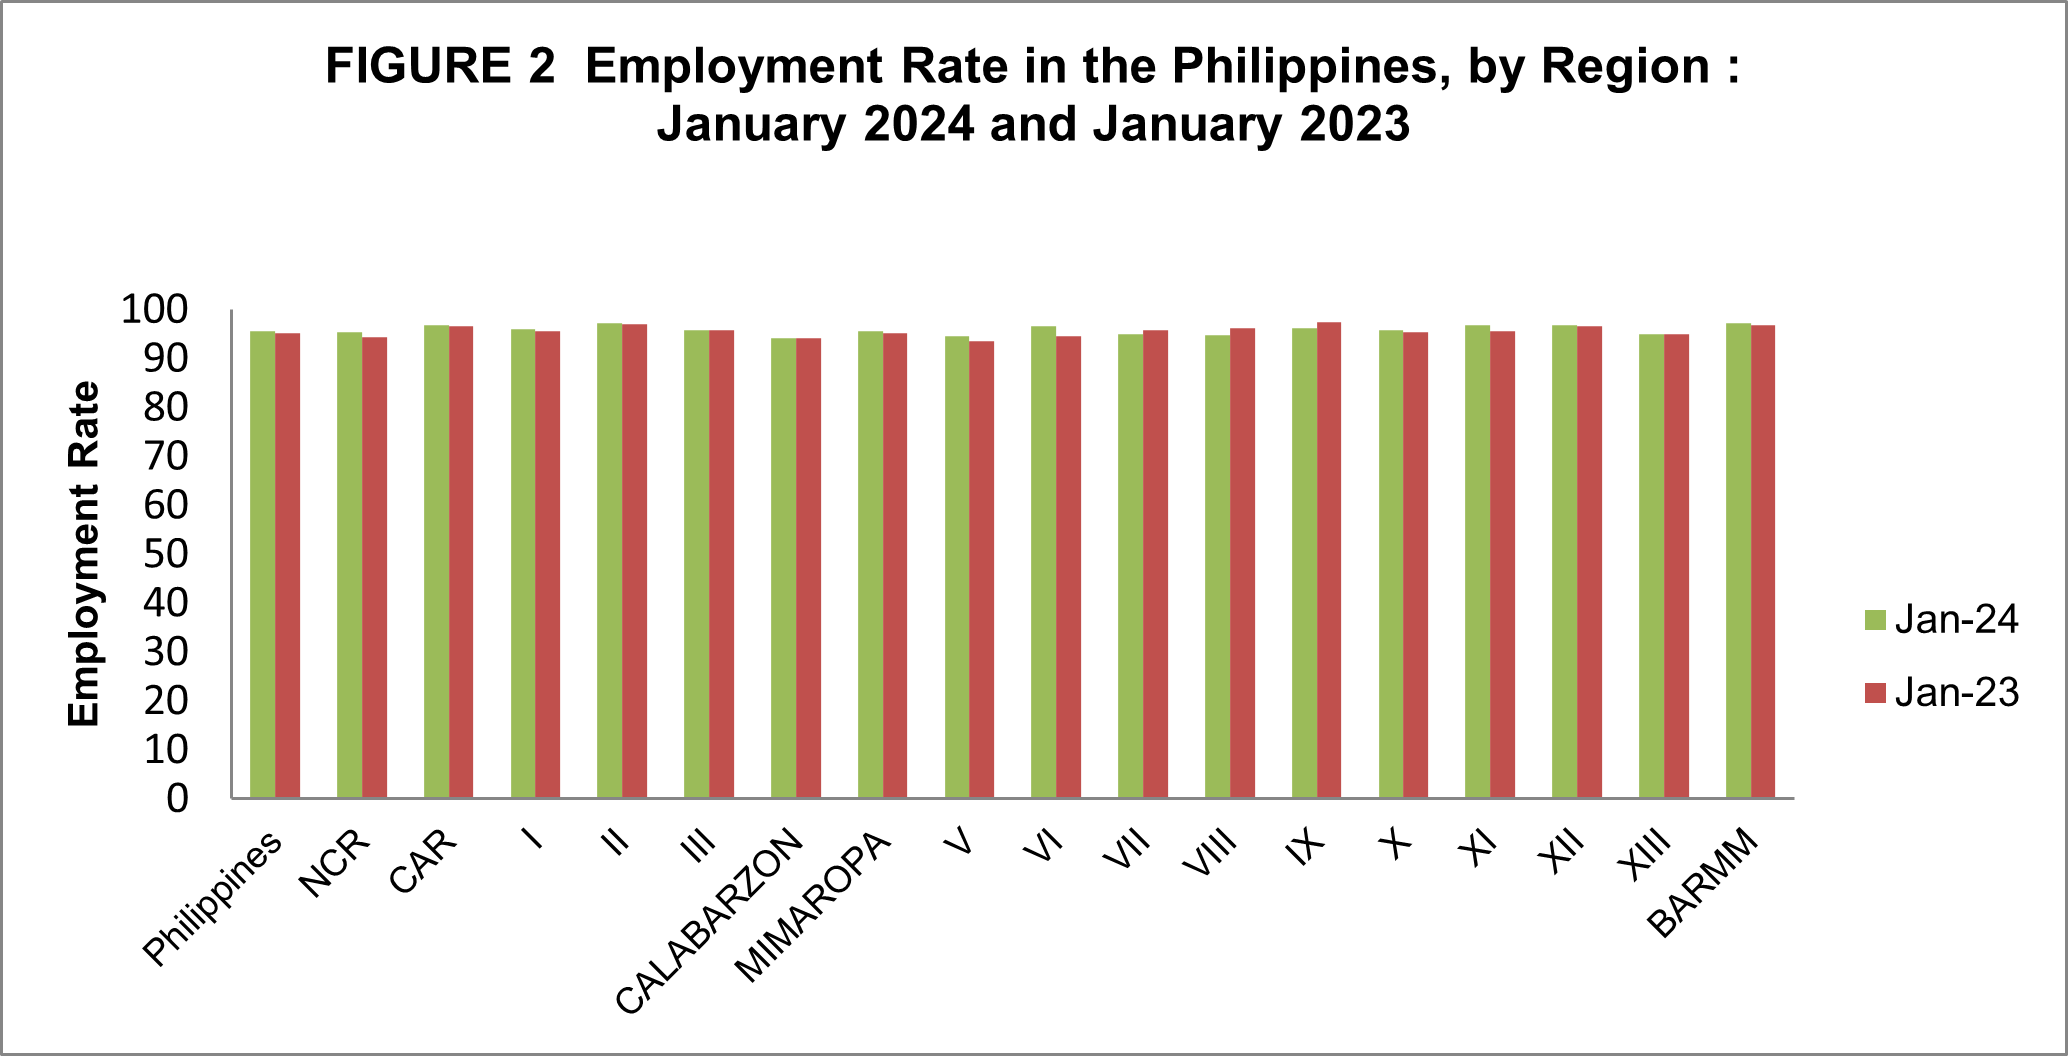
MIMAROPA Region’s employment rate was recorded at 95.6 percent in January 2024. This estimate is 0.5 percentage point higher than that of the previous year, which was 95.1 percent. MIMAROPA’s employment rate in January 2024 is 0.1 percentage point higher than the national estimate of 95.5 percent.
Source: Philippine Statistics Authority, Labor Force Survey
Figure 2 shows that Region II and BARMM recorded the highest employment rate at 97.1 percent in January 2024, an increase of 0.1 percentage point from the same month of 2023 at 97.0 percent for Region II while an increase of 0.3 percentage point at 96.8 percent for BARMM in 2023. On the other hand, CALABARZON recorded the lowest employment rate in January 2024 and 2023 with 94.1 percent.
Unemployment rate of MIMAROPA decreased by 0.5 percentage point
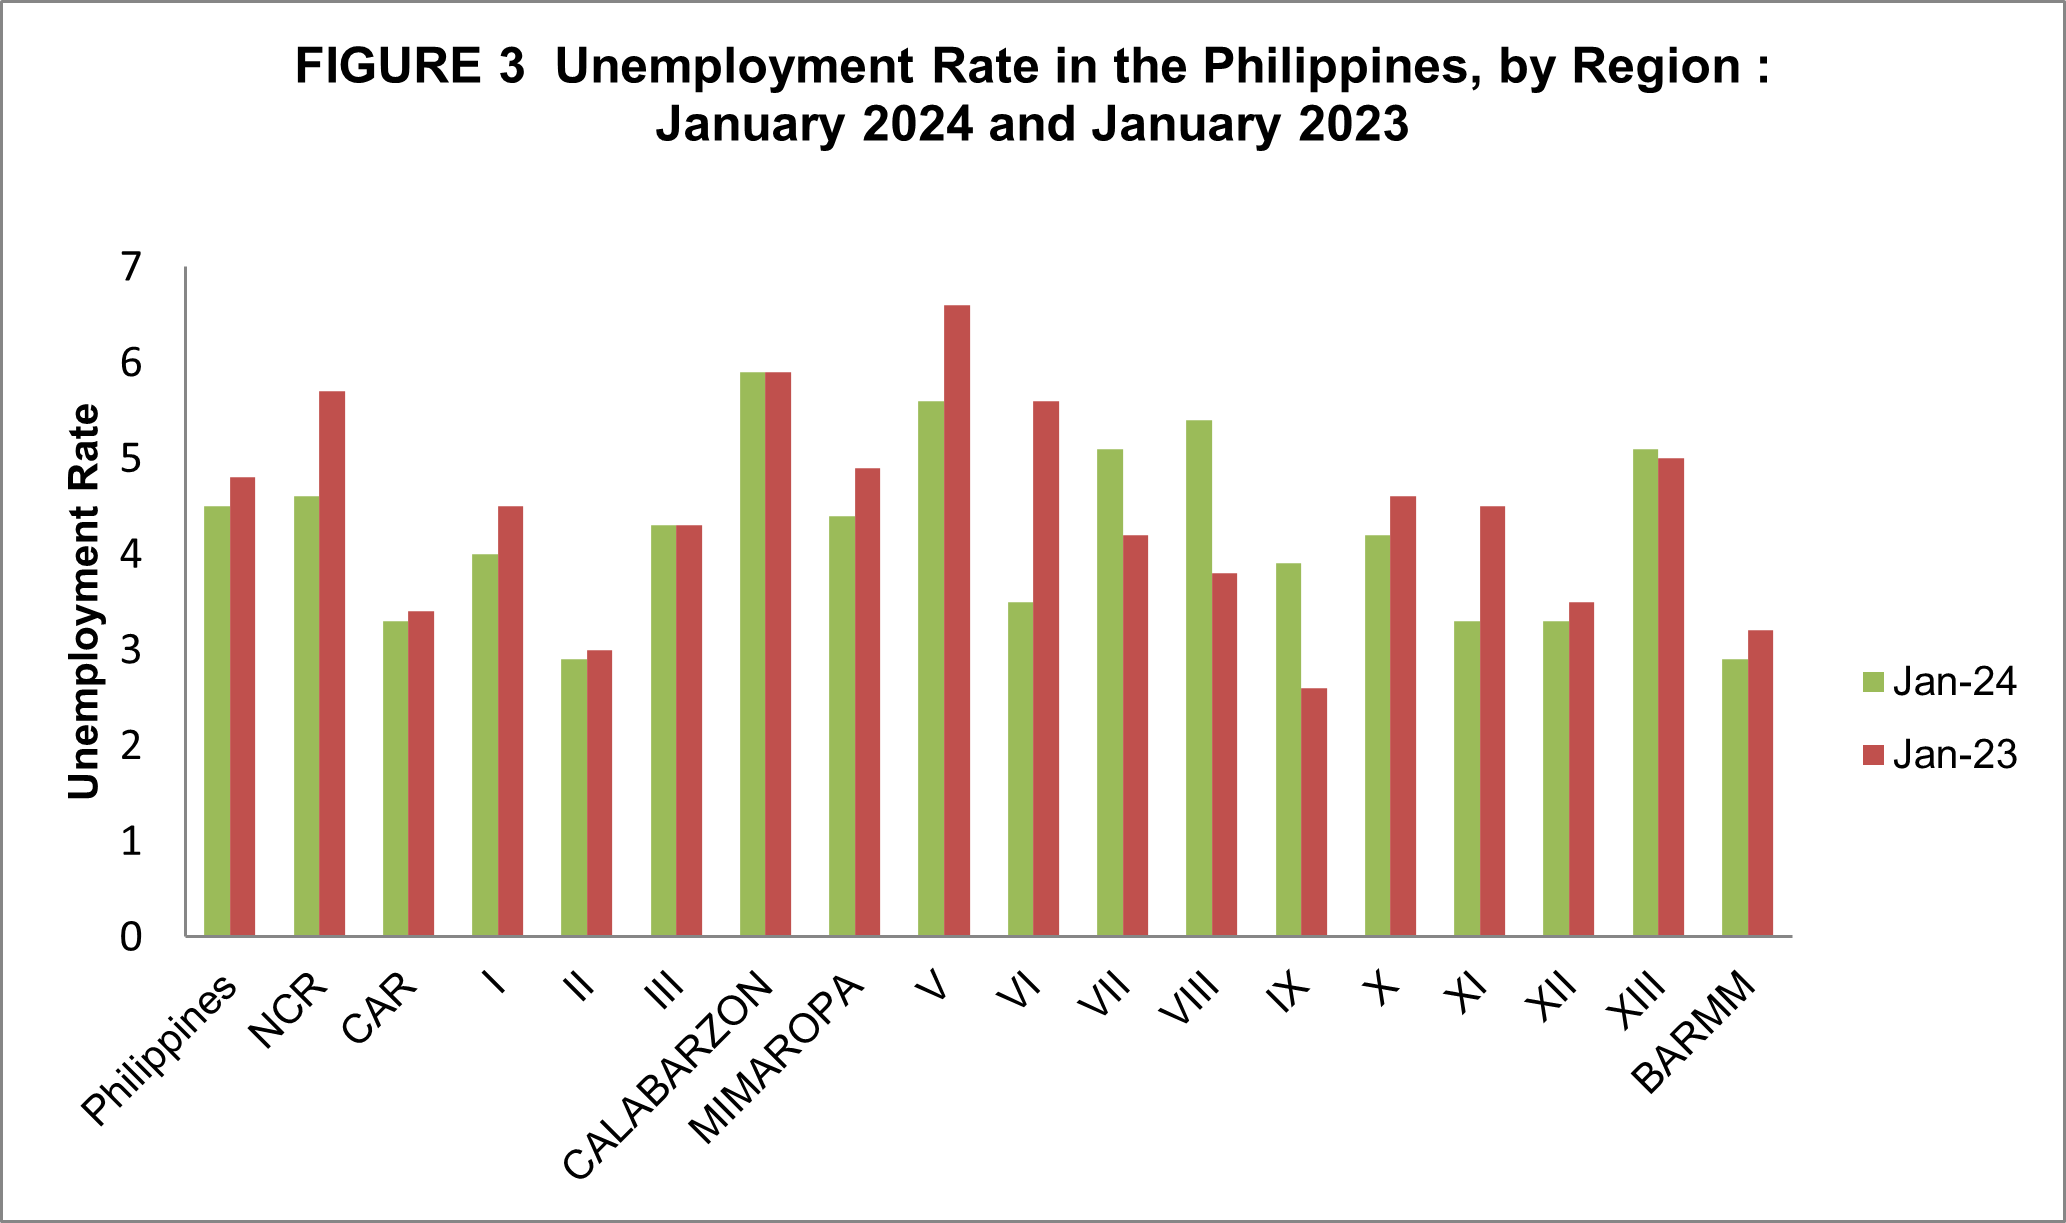
The unemployment rate of MIMAROPA decreased by 0.5 percentage point, that is, from 4.9 percent in January 2023 to 4.4 percent in January 2024. MIMAROPA’s unemployment rate in January 2024 was 0.1 percentage point lower than that of the national estimate of 4.5 percent.
Source: Philippine Statistics Authority, Labor Force Survey
Figure 3 shows that CALABARZON recorded the highest unemployment rate at 5.9 percent in January 2024. Region V topped with 6.6 percent in January 2023. On the other hand, Region II recorded the lowest unemployment rate with 2.9 percent in January 2024. Region IX trailed at 2.6 percent in unemployment rate in January 2023.
Underemployment rate of MIMAROPA decreased by 7.9 percentage points
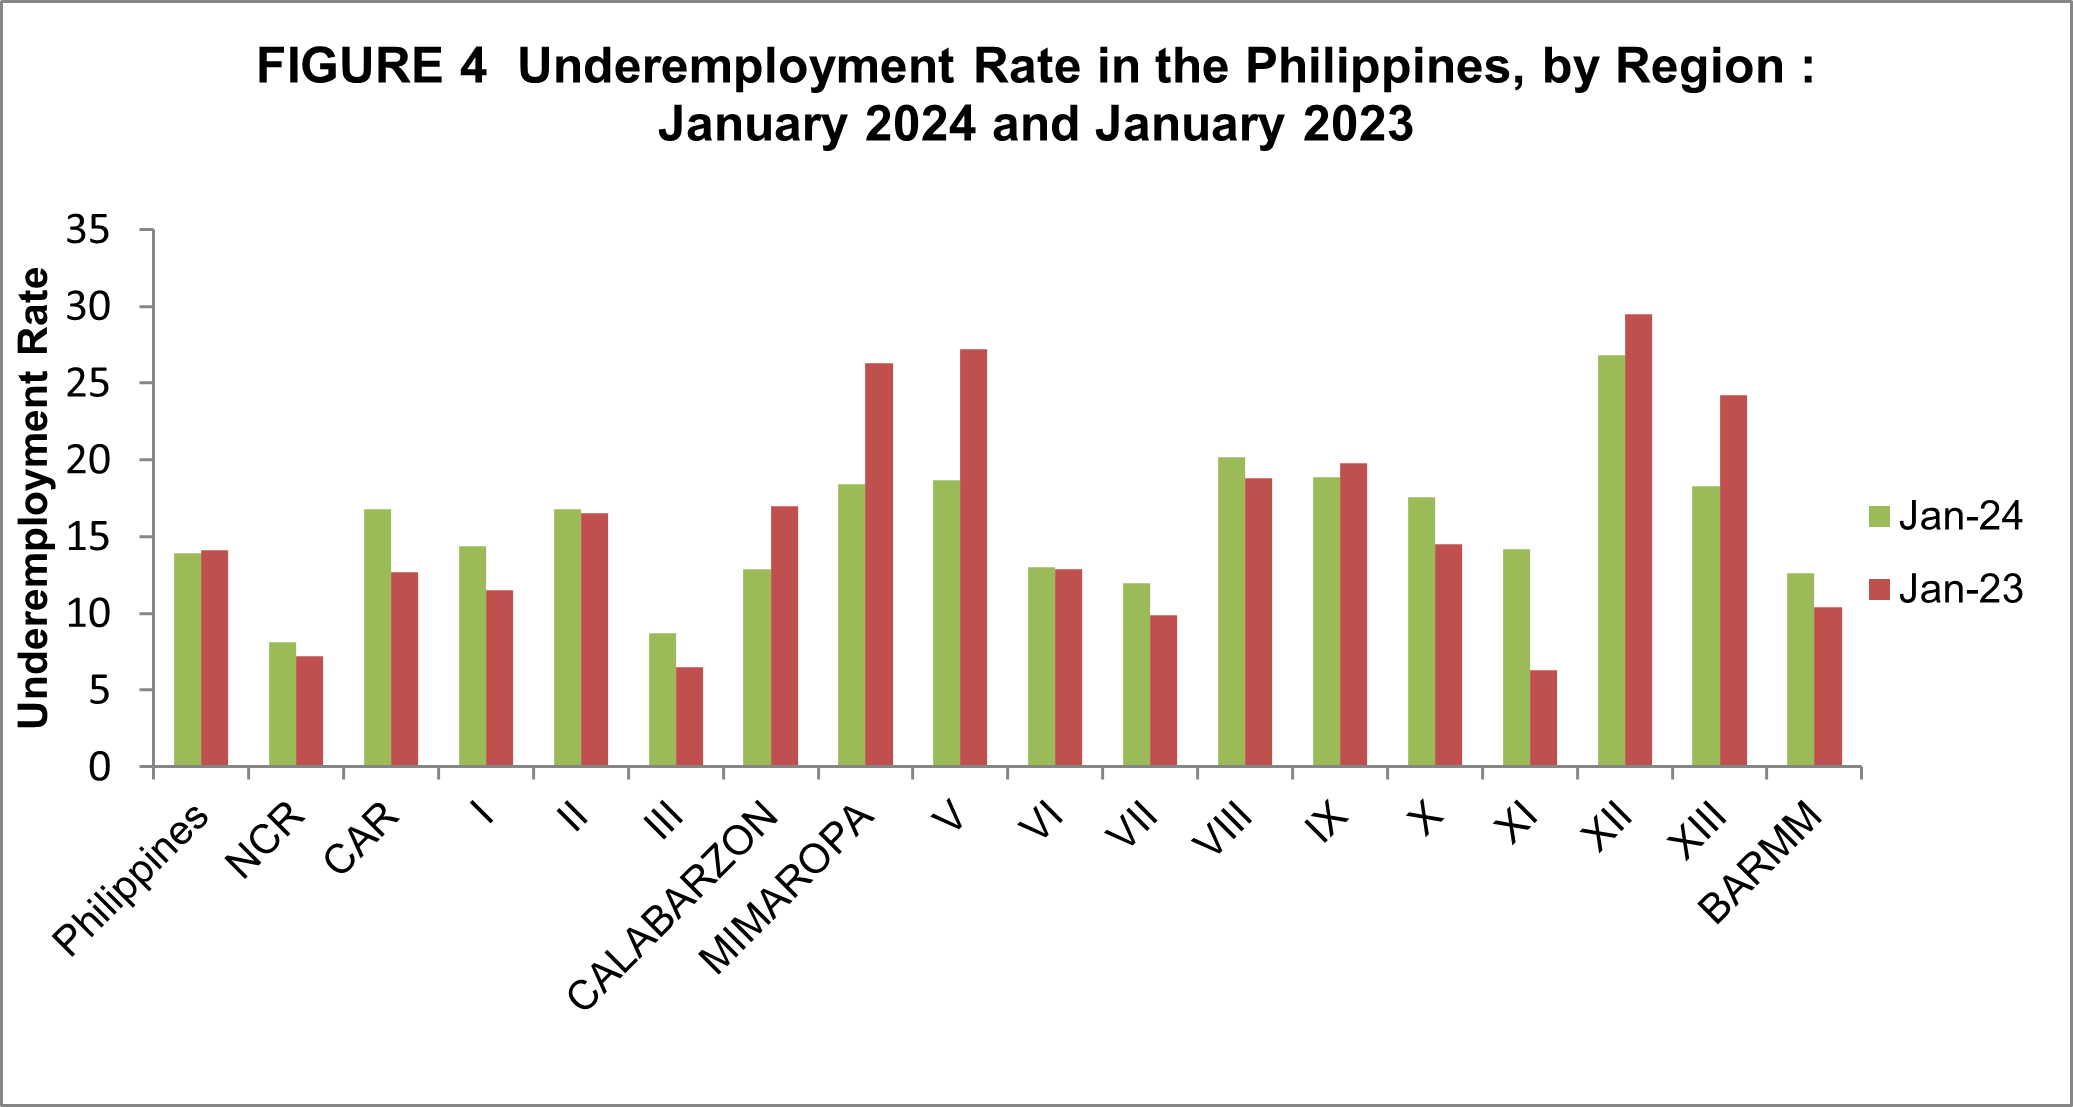
The underemployment rate of MIMAROPA decreased by 7.9 percentage points, that is, from 26.3 percent in January 2023 to 18.4 percent in January 2024. MIMAROPA’s underemployment rate in January 2024 was 4.5 percentage points higher than that of the national estimate of 13.9 percent.
Source: Philippine Statistics Authority, Labor Force Survey
Figure 4 shows that among regions in the country, Region XII recorded the highest underemployment rate at 26.8 percent in January 2024 and also in January 2023 with 29.5 percent. On the other hand, NCR recorded the lowest underemployment rate with 8.1 percent in January 2024 and Region XI was at 6.3 percent in January 2023.
Technical Notes
The Labor Force Survey (LFS) is a vehicle to gather such data on the demographic and socio-economic characteristics of the population with nationwide coverage and conducted on a quarterly and monthly mode by interviewing households. For this release, the data being presented are based on the preliminary results of the January 2024 round of the LFS.
The reference period used in the survey is the past seven (7) days preceding the date of visit of the enumerator. The regular LFS (January, April, July, and October LFS rounds) has four replicates to a total of 42,768 secondary sampling units (SSUs) while the special LFS (February, March, May, June, August, September, November, and December LFS rounds) has one replicate equivalent to a total of 10,692 secondary sampling units (SSUs).
Computation of the labor index:
Labor Force Participation Rate = LFPR=LF/P×100
Employment Rate = ER=E/LF x 100
Unemployment Rate = UR=U/LF×100
Underemployment Rate = U_n R=Un/E×100
where:
LFPR = Labor Force Participation Rate’
LF = total number of persons in the labor force
P = total population 15 years old and over
E = total number of employed persons
U = total number of unemployed persons
Un = total number of underemployed persons
Employed - Include all persons 15 years old and over as of their last birthday and during the basic survey reference period are reported as either: a. At work. Those who do any work even for one hour during the reference period for pay or profit, or work without pay on the farm or business enterprise operated by a member of the same household related by blood, marriage, or adoption; OR b. With a job but not at work. Those who have a job or business but are not at work because of temporary illness/injury, vacation, or other reasons. Likewise, persons who expect to report for work or to start operation of a farm or business enterprise within two weeks from the date of the enumerator's visit, are considered employed.
Notes: This definition is based on the ILO definition for employed.
Unemployed ¬-The unemployed include all persons who are 15 years old and over as of their last birthday and are reported as:
without work, i.e., had no job or business during the basic survey reference period; and currently available for work, i.e., were available and willing to take up work in paid employment or self-employment during the basic survey reference period, and/or would be available and willing to take up work in paid employment or self-employment within two weeks after the interview date, and seeking work, i.e., had taken specific steps to look for a job or establish a business during the basic survey reference period.
Underemployed - Include employed persons who express the desire to have additional hours of work in their present job or an additional job, or to have a new job with longer working hours.
The new definition of unemployed was adopted starting April 2005 per NSCB Resolution No. 15 dated October 20, 2004.
The 2012 Philippine Standard Occupational Classification (PSOC) was adopted starting April 2016. The 1992 PSOC had been used prior to April 2016.
Starting with the October 2019 LFS round, the population projections based on the 2015 Population Census (POPCEN 2015) has been adopted to generate the labor force statistics.
Starting January 2017 round, Computer Aided Personal Interviewing (CAPI) using Tablet was utilized in the LFS enumeration.
Overseas Filipino Workers are not considered part of the labor force in the Philippines. Hence, in the LFS, data on economic characteristics of household members who are overseas workers are not collected. For the LFS reports, they are excluded in the estimation of the size of working population, that is, population aged 15 years and older, and in the estimation of the labor force.
In January 2019, the 2017 Philippine Standard Classification of Education (PSCED) has been adopted. The categories for highest grade completed were aldo revised considering the K to 12 programs in the education system.
(SGD) LENI R. RIOFLORIDO
Regional Director
MLLM/OHG/EVC/CBDT
| Attachment | Size |
|---|---|
|
|
2.69 MB |