

Release Date :
Reference Number :
2024SR-010
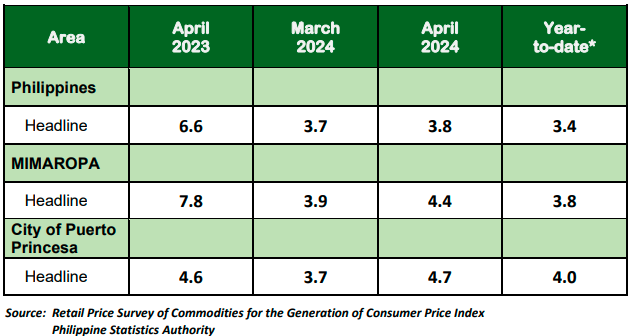
Table A. Year-on-Year Inflation Rates: Philippines,
MIMAROPA, and the City of Puerto Princesa
All Items, In Percent
(2018=100)
City of Puerto Princesa
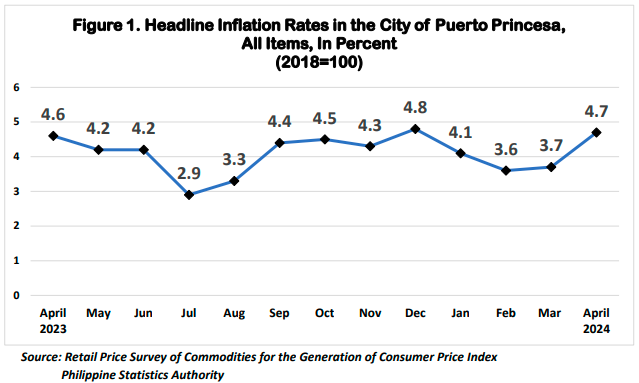
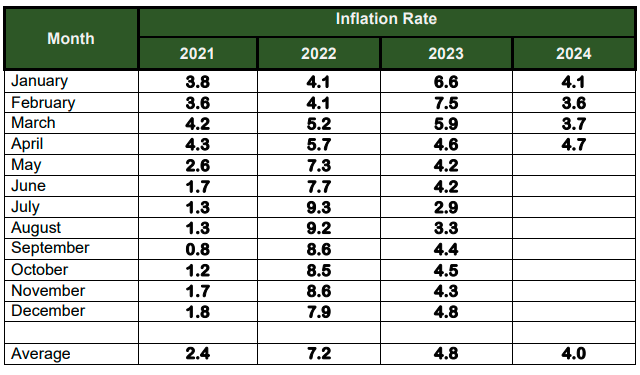
The headline inflation in the City of Puerto Princesa for April 2024 significantly accelerated to 4.7 percent from 3.7 percent in the previous month. In March 2023, the headline inflation was slightly lower, at 4.6 percent. (Tables A, B and Figure 1)
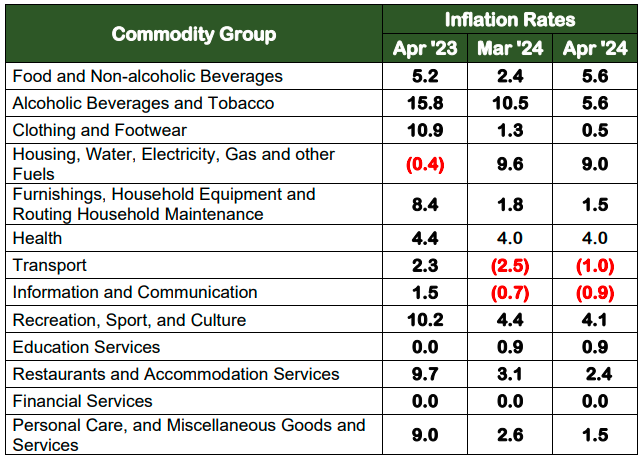
The uptrend in the overall inflation in the city was primarily influenced by the higher year-on-year increase in the heavily-weighted Food and Non-alcoholic beverages posted at 5.6 percent, from 2.4 percent in March 2024. This was followed by Transport, at -1.0 percent from -2.5 percent last month.
On the other hand, lower growth rates were observed in the following commodities:
a. Restaurants and Accommodation Services, 2.4 percent from 3.1 percent;
b. Personal Care, and Miscellaneous Goods and Services, 1.5 percent, from 2.6 percent;
c. Alcoholic Beverages and Tobacco, 5.6 percent from 10.5 percent;
d. Housing, Water , Electricity, Gas and Other Fuels at 9.0 percent from 9.6 percent;
e. Clothing and Footwear, 0.5 percent from 1.3 percent;
f. Furnishings, Household Equipment and Routing Household Maintenance, 1.5 percent from 1.8 percent;
g. Information and Communication at -0.9 percent from -0.7 percent; and
h. Recreation Sport and Culture, 4.1 percent from 4.4 percent.
Meanwhile, three commodity groups retained their previous month’s inflation rates, namely: Education Services at 0.9 percent; Financial Services at 0.0 percent; and Health at 4.0 percent.
Table B. Year-on-Year Inflation Rates in the City of Puerto Princesa,
All Items, In Percent
(2018=100)
Food index for April 2024 increased significantly to 5.9 percent inflation rate, from 2.3 percent in the previous month. In April 2023, the food index was much lower, at 4.8 percent inflation rate. (Table C)
The acceleration of the food inflation for the month was brought about by the higher index for Fish and other seafood, posted at 1.1 percent from -9.2 percent in the previous month. This was followed by Cereals and cereal products, with 14.4 percent inflation rate, from 12.4 percent last month. Vegetables, Tubers, Plantains, Cooking Bananas, and Pulses, which posted an inflation rate of -2.1 percent, from -7.4 percent also contributed to the uptrend.
Also instrumental to the uptrend in the food inflation are the following commodity
groups:
a. Meat and Other Parts of Slaughtered Land Animals, 4.3 percent rate, from 2.9 percent;
b. Fruits and Nuts, 6.4 percent, from 2.7 percent;
c. Sugar, Confectionery, and Desserts, -4.3 percent from -5.2 percent; and
d. Flour, Bread and other Bakery Products, Pasta Products and other Cereals, -0.5 percent from -1.0 percent.
On the contrary, lower inflation rates were observed in the commodity food groups Oils and Fats, at -5.7 percent, from -4.9 percent; and Ready-made Food and Other Food Products n.e.c., at 1.9 percent, from 2.8 percent in the previous month.
The commodity group Milk, Other Dairy Products and Eggs, retained its inflation rate of 1.0 percent.
Table C. Year-on-Year Inflation Rates in City of Puerto Princesa,
By Food Group, In Percent
(2018=100)
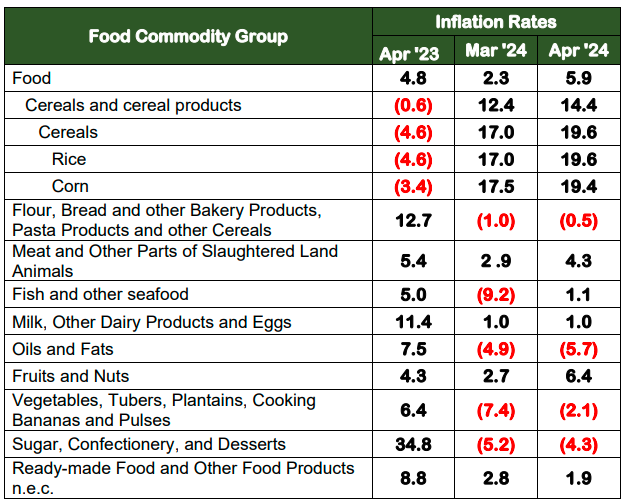
Table D. Year-on-Year Inflation Rates in City of Puerto Princesa,
All Items, In Percent
January 2021 – April 2024
(2018=100)
(SGD) MARIA LALAINE M. RODRIGUEZ
Chief Statistical Specialist
| Attachment | Size |
|---|---|
|
|
367.69 KB |