

Release Date :
Reference Number :
2025-SR-049
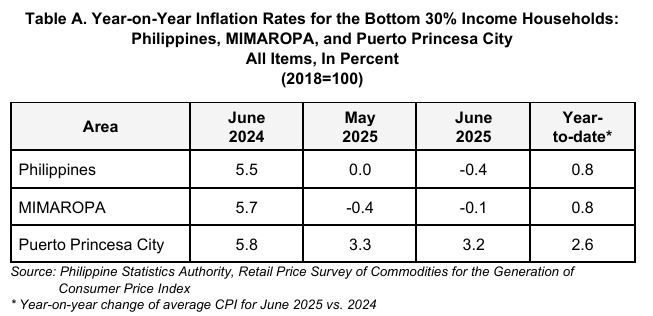
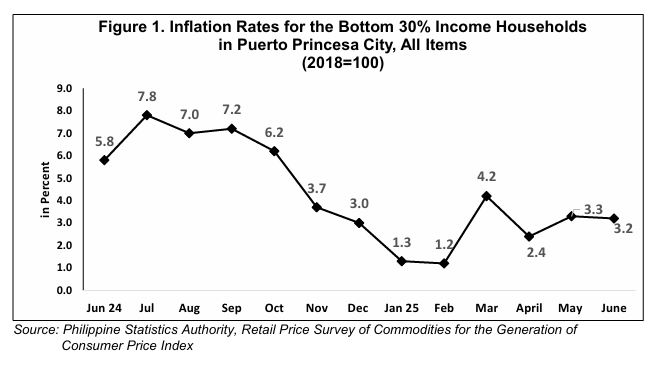
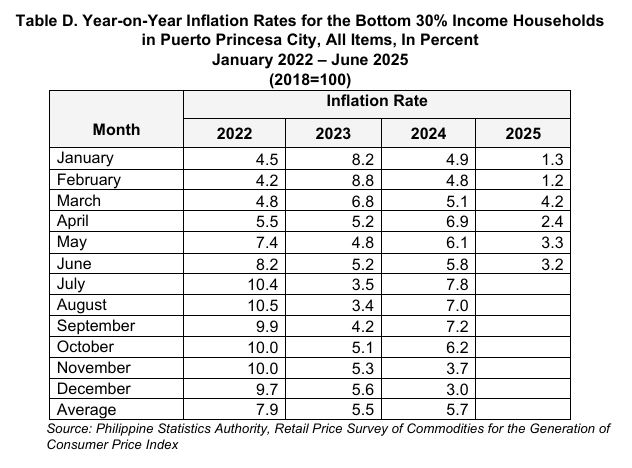
Inflation rate for the bottom 30% income households in the City of Puerto Princesa decreased to 3.2 percent in June 2025 from 3.3 percent in May 2025. In June 2024, inflation rate was higher at 5.8 percent. (Table A and Figure 1)
The main driver to the downward trend in the city’s inflation for this income group in June 2025 was the lower year-on-year growth in the heavily weighted Housing, Water, Electricity, Gas and other Fuels at 2.3 percent from 5.3 percent annual decline in May 2025. Also contributing to the decreased in the overall inflation is Restaurants and Accommodation Services at 8.0 percent from 12.0 percent in the previous month, and Transport at a decline of 1.9 percent during the month from an annual decline of 1.0 percent in the previous month.
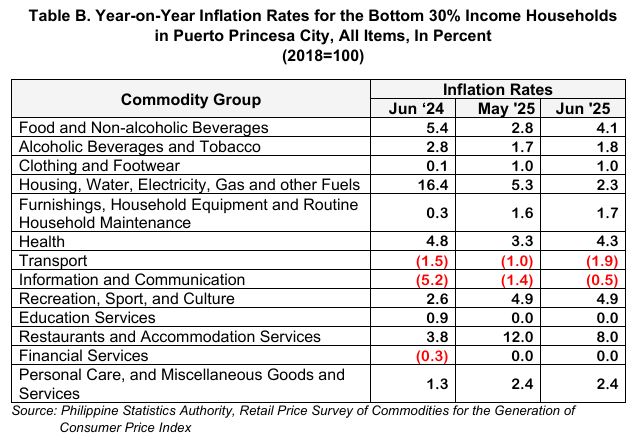
In contrast, higher annual growth rates were noted in the indices of Food and Non-Alcoholic Beverages at 4.1 percent, Alcoholic Beverages and Tobacco at 1.8 percent, Furnishing, Household Equipment and Routine Household Maintenance at 1.7 percent, Health at 4.3 percent, and Information and Communication at a decline of 0.5 percent from an annual decline of 1.4 percent.
Meanwhile, the indices for Clothing and Footwear, Recreation, Sport and Culture, Education Services, Financial Services, Personal Care, and Miscellaneous Goods and Services retained their May 2025.
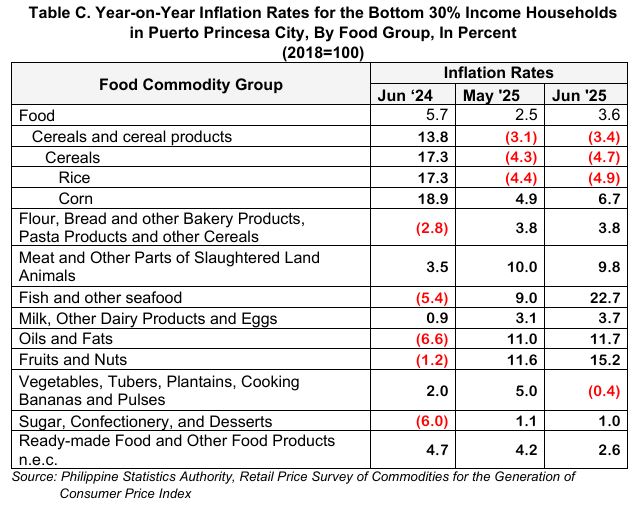
Food inflation for the bottom 30% income households in the City of Puerto Princesa moved at a faster pace at 3.6 percent in June 2025 from a 2.5 percent annual increase in the previous month. In June 2024, its annual increase was observed to be higher at 5.7 percent. (Table C)
The uptrend in the food inflation in the highly urbanized city was mainly due to the faster growth in Fish and other seafood at 22.7 percent from 9.0 percent in the previous month. This was followed by higher indices of Fruits and Nuts at 15.2 percent from 11.6 percent, Milk, other dairy products and eggs at 3.7 percent from 3.1 percent.
On the other hand, lower annual decreases were also noted in the following food groups:
a) Cereals and cereal products, -3.4 percent from -3.1 percent;
b) Meat and other parts of slaughtered land animals, 9.8 percent from 10.0 percent;
c) Vegetables tubers plantains cooking bananas and pulses, -0.4 percent from 5.0 percent;
d) Sugar, confectionery and desserts, 1.0 percent from 1.1 percent; and
e) Ready-made food and other food products n.e.c, 2.6 percent from 4.2 percent.
DONNA MARIE D. MOBE
(Supervising Statistical Specialist)
Officer-in-Charge
Provincial Statistical Office Palawan
MQV/MDO
| Attachment | Size |
|---|---|
|
|
674.68 KB |