

Release Date :
Reference Number :
2022-022
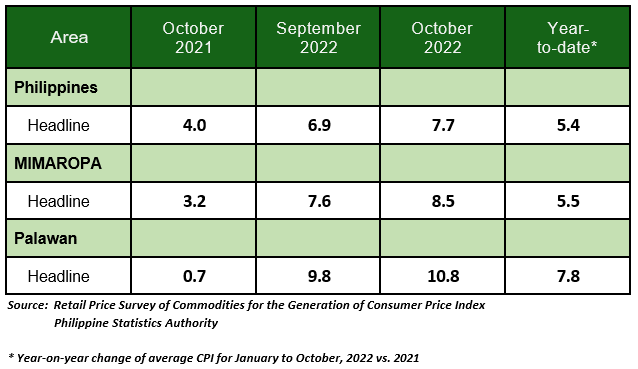
Table A. Year-on-Year Inflation Rates: Philippines, MIMAROPA, and Palawan All Items, In Percent (2018=100)
Palawan
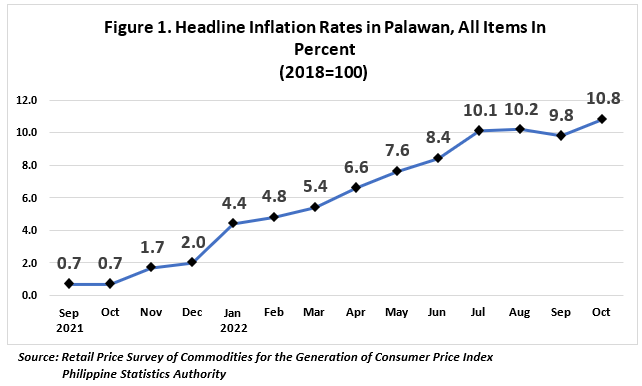
The headline inflation in Palawan exhibited again an uptrend as it moved to 10.8 percent in October 2022, from a slowdown of 9.8 percent in September 2022. This is the highest-ever recorded inflation for the province of Palawan. The average inflation for the first ten months of the year was registered at 7.8 percent, (Table A and Figure 1).
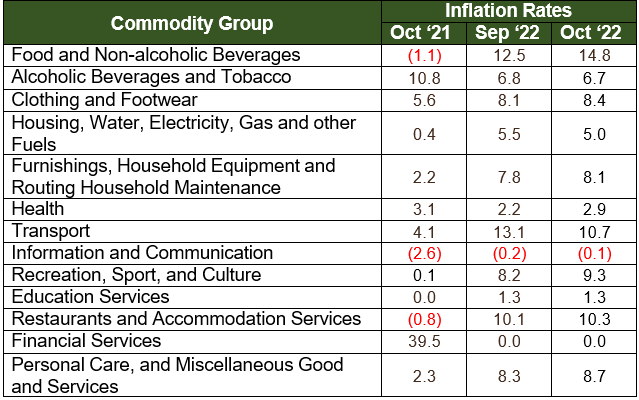
The renewed uptrend in the provincial inflation is attributed to the higher annual increment in the index for Food and non-alcoholic beverages at 14.8 percent, from 12.5 percent in September 2022. Contributing to the uptrend was also observed in Personal Care, and Miscellaneous Goods and Services, at 8.7 percent and Health, at 2.9 percent, (Table B). Furthermore, higher indices were also observed in the following commodity groups:
a. Clothing and footwear, 8.4 percent.
b. Restaurant and accommodation services, 10.3 percent.
c. Recreation, Sport, and Culture, 9.3 percent.
d. Furnishings, Household Equipment and Routine Household Maintenance, 8.1 percent.
e. Information and communication; (0.1).
On the other hand, the rest of the commodity groups either retained their previous month’s inflation rates or registered lower price indices during the month.
Table B. Year-on-Year Inflation Rates in Palawan, All Items In Percent (2018=100)
Food index for October 2022 was posted at 15.3 percent, higher than its previous month’s value of 12.8 percent. In September 2021, the food index was lower, at -1.5 percent, (Table C).
During this period, major contributors to the growth in the food index are Fish and other seafood at 24.4 percent followed by Vegetables, tubers, plantains, cooking bananas and pulses at 13.4 percent; and Sugar, Confectionery, and desserts at 63.9 percent. Other contributors to the increase in the food index are Meat and other parts of slaughtered land animals at 21.2 percent; Fruits and Nuts, at 19.8 percent; Flour, Bread and Other Bakery Products, Pasta Products, Other Cereals at 12.8 percent; Ready-made food and other food products N.E.C. at 15.4 percent; and Corn at 3.3 percent.
Meanwhile, other commodities posted lower indices such as Cereals Products (except Corn) at 7.7 percent, Milk & Other dairy products & eggs at 7.4 percent and Oils and fats at 17.7 percent
Table C. Year-on-Year Inflation Rates in Palawan, By Food Group In Percent (2018=100)

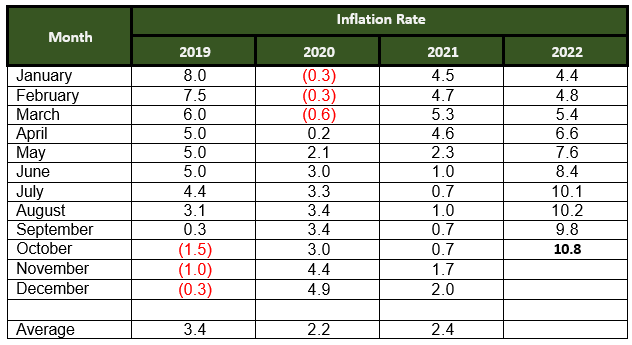
Table D. Year-on-Year Inflation Rates in Palawan, All Items In Percent January 2019 – October 2022 (2018=100)

| Attachment | Size |
|---|---|
|
|
195.71 KB |