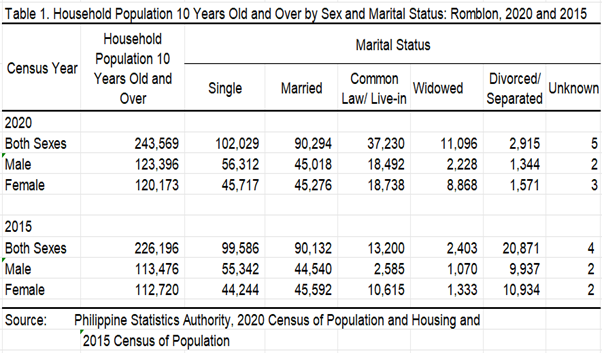
1. Based on the 2020 Census of Population and Housing (2020 CPH), the province of Romblon has a total household population of 308,072 persons. Of this total, household population 10 years old and over comprised comprised 79.1 percent or 243,569 persons.
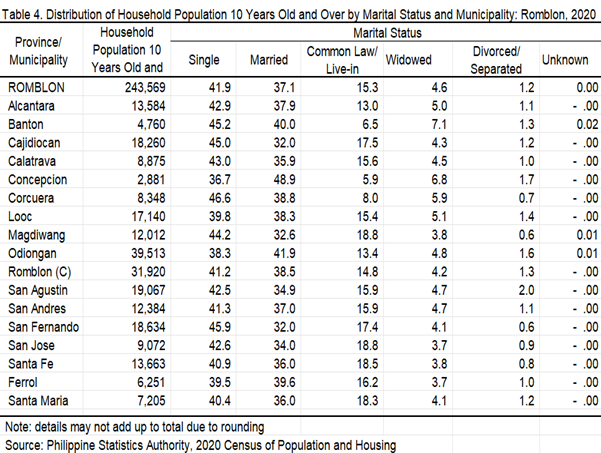
2. Of the 243,569 persons aged 10 years old and over in 2020, a total of 102,029 persons (41.9%) were never married, while 90,294 persons (37.1 percent) were married. The rest of the population was categorized as follows: in common-law/live-in marital arrangement with 15.3 percent, widowed with 4.6 percent, and divorced/separated/annulled with 1.2 percent.
Figure 1. Percent Distribution of Household Population 10 Years Old and Over by Marital Status: Romblon, 2020 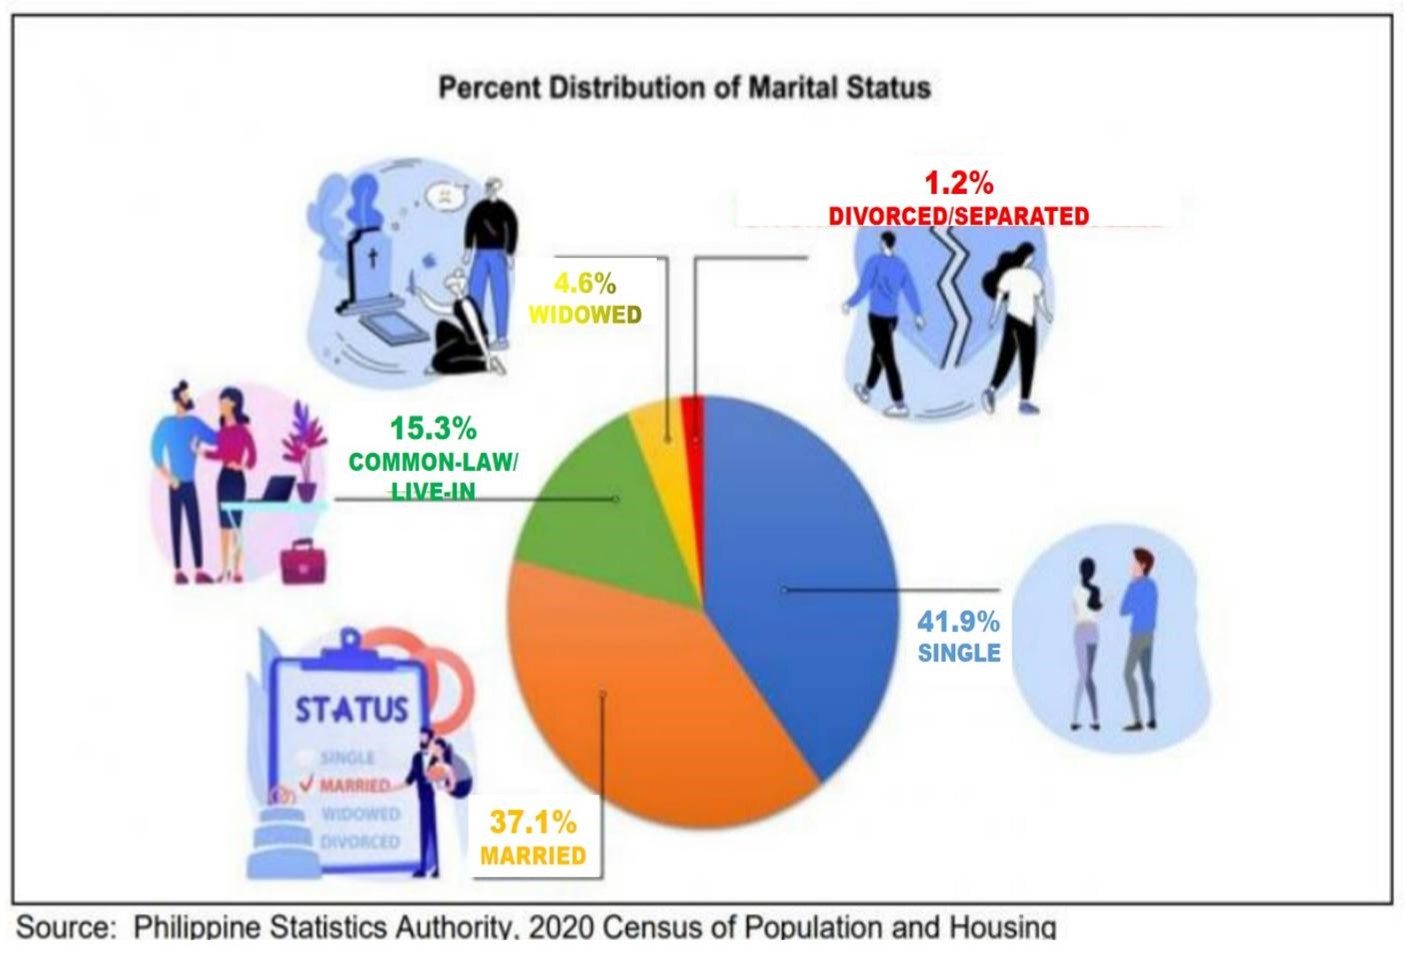
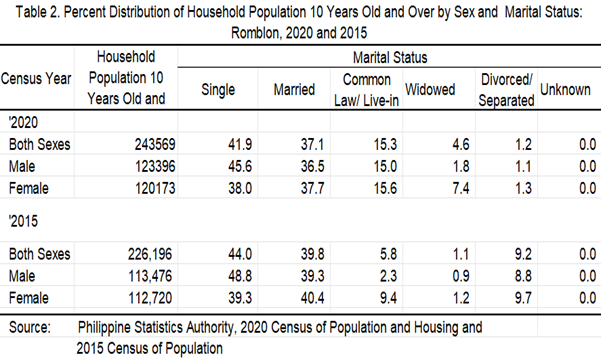
3. A decline of 2.1 percentage points in single or never-married persons was observed between 2015 and 2020, from 44.0 percent in 2015 to 41.9 percent in 2020. (Table 2)
4. There was also a decline in the percentage of married persons in between 2015 and 2020, from 39.8 percent in 2015 to 37.1 percent in 2020. (Table 2)
5. Among individuals with common law or live-in arrangements, the percentage increased from 5.8 percent in 2015 to 15.3 percent in 2020. The same trend was observed among those widowed, registering 1.1 percent in 2015 to 4.6 percent in 2020. On the other hand, the percentage of divorced/separated decreased from 9.2 percent in 2015 to 1.2 percent in 2020. (Table 2)
6. In terms of distribution by sex, 45.6 percent of households were composed of single men while 38.0 percent were composed of single women. On the other hand, 36.5 percent of males and 37.7 percent of females were married. Meanwhile, 15.0 percent of males and 15.6 percent of females were in common law or live-in marital arrangements. The remaining percentage was distributed between widowed and divorced/separated/annulled. The widowed has a percentage of 1.8 percent for males and 7.4 percent for their female counterparts. Finally, the percentage of divorced/separated/annulled males and females was 1.1 percent and 1.3 percent, respectively. (Table 2)
There are more males than females among the never-married persons
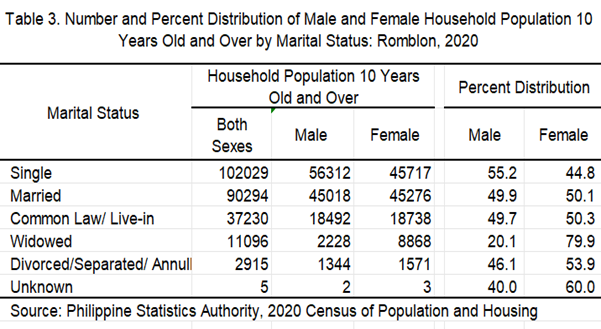
7. Among the never-married persons, a higher proportions of males (55.2%) were reported in 2020 than its female counterparts. However, opposite trend had been observed among married and those in common-law/live-in marital arrangements with 49.9 percent and 49.7 percent, respectively. (Table 3)
8. The proportion of females was higher than males among widowed (79.9%) and divorced/separated/annulled (53.9%). (Table 3)
Corcuera posts the highest proportion of single individuals, Concepcion for married individuals
9. By municipality, the proportion of single or never-married individuals was highest in Corcuera at 46.6 percent. This was followed by San Fernando with 45.9 percent and Banton with 45.2 percent. Meanwhile, Concepcion posted the lowest proportion of never-married individuals at 36.7 percent. (Table 4)
10. Concepcion posted the highest proportion of married persons with 48.9 percent. This was followed by Odiongan with 41.9 percent, Banton with 40.0 percent, Ferrol with 39.6 percent and Corcuera with 38.8 percent. On the other hand, the lowest proportion of married persons was observed in Cajidocan and San Fernando with both 32.0 percent. (Table 4)
Common law/Live-in marital arrangement is most prevalent in the municipalities of Magdiwang and San Jose
11. The proportion of persons in common law or live-in marital arrangement was highest in the municipalities of Magdiwang and San Jose, both with 18.8 percent. It was followed by Santa Fe with 18.5 percent and and Santa Maria with 18.3 percent. The lowest proportion was observed in Banton with only 6.5 percent. (Table 4).
12. Meanwhile, the prevalence of divorced/separated/annulled indoviduals was highest in San Agustin with 2.0 percent. (Table 4)
13. On the other hand, the proportion of widowed persons was highest in Banton with 7.1 percent. It was followed by Concepcion with 6.8 percent and Looc with 5.1 percent. (Table 4)
The statistics presented in this report were based on the information provided by the respondent or any responsible household member who answered the questions and gave correct information about all the household members.
In the 2020 CPH, data on the marital status of every household member 10 years old and over were collected by asking the respondents, “Is _______ single, married, common-law/live-in, widowed, or divorced/separated/annulled?”
(SGD) JOHNNY F. SOLIS
Chief Statistical Specialist

