

Release Date :
Reference Number :
2025SR-02-011
INFLATION RATE FOR ALL INCOME HOUSEHOLDS
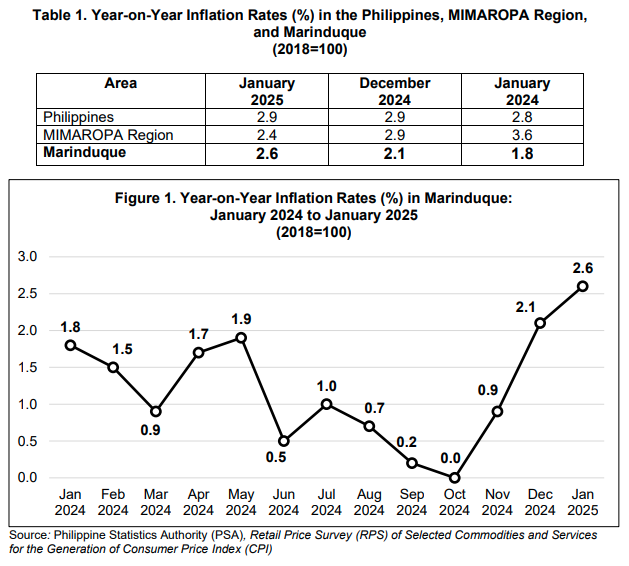
The headline inflation rate at the provincial level further increased to 2.6 percent in January 2025, or a change of 0.5 percentage points from the inflation rate in the previous month. In the same reference month of the previous year, it was posted at 1.8 percent. The uptrend of inflation in January 2025 was mainly driven by the combined acceleration in the indices for selected commodity groups such as food and non-alcoholic beverages at 4.3 percent, transport at -0.6 percent, and housing, water, electricity, gas and other fuels at 3.3 percent.
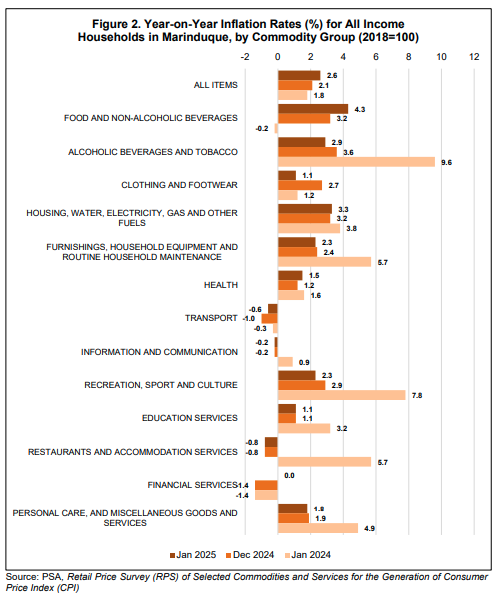
Furthermore, the annual indices for financial services and health also showed higher growth compared to the previous month, at 0.0 percent and 1.5 percent, respectively. On the other hand, lower annual increments were observed in the inflation rates of the following commodity groups:
• Alcoholic beverages and tobacco, 2.9%;
• Clothing and footwear, 1.1%;
• Furnishings, household equipment and routine household maintenance, 2.3%;
• Recreation, sport and culture, 2.3%; and,
• Personal care, and miscellaneous goods and services, 1.8%.
Meanwhile, the indices of the following commodity groups maintained compared with the annual figures from the previous month:
• Information and communication, -0.2%;
• Education services, 1.1%; and,
• Restaurants and accommodation services, -0.8%.
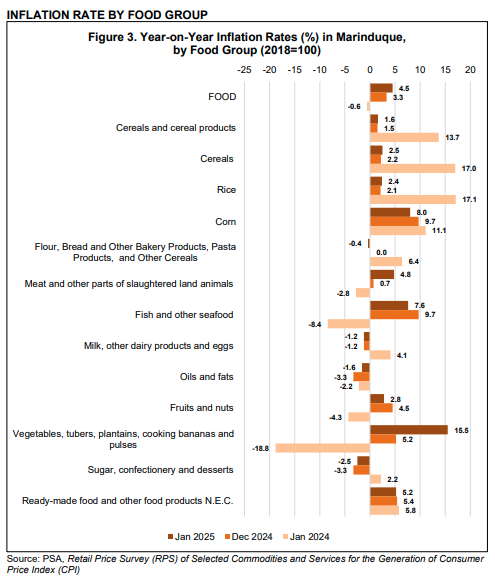
The province’s food index further accelerated to 4.5 percent in January 2025, from 3.3 percent in the previous month. This was equivalent to a change of 1.2 percentage points. In January 2024, the food inflation rate was lower at -0.6 percent. The uptrend in food inflation was mainly due to the acceleration in the indices of vegetables, tubers, plantains, cooking bananas and pulses at 15.5 percent, and meat and other parts of slaughtered land animals at 4.8 percent.
Furthermore, the annual indices of the following food items exhibited higher growth when compared with the annual figure from the previous month, as follows:
• Rice, 2.4%;
• Oils and fats, -1.6%;
• Sugar, confectionery and desserts, -2.5%;
Moreover, the annual indices of the following food items exhibited lower growth when compared with the annual figure from the previous month, as follows:
• Corn, 8.0%;
• Flour, bread and other bakery products, pasta products, and other cereals, -0.4%;
• Fish and other seafood, 7.6%;
• Fruits and nuts, 2.8%; and,
• Ready-made food and other food products N.E.C., 5.2%.
On the other hand, the annual index for milk, other dairy products, and eggs remained the
same as the previous month, at -1.2 percent.
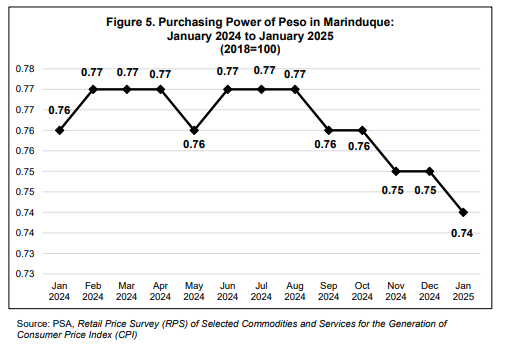
PURCHASING POWER OF PESO
The Purchasing Power of Peso (PPP) in Marinduque declined to PhP 0.74 in January 2025, down from PhP 0.76 in January 2024. As a result, consumers are now able to purchase fewer goods compared to when the PPP was higher.
TECHNICAL NOTES
(SGD)GEMMA N. OPIS
Chief Statistical Specialist
PSA PSO Marinduque
| Attachment | Size |
|---|---|
|
|
277.53 KB |