

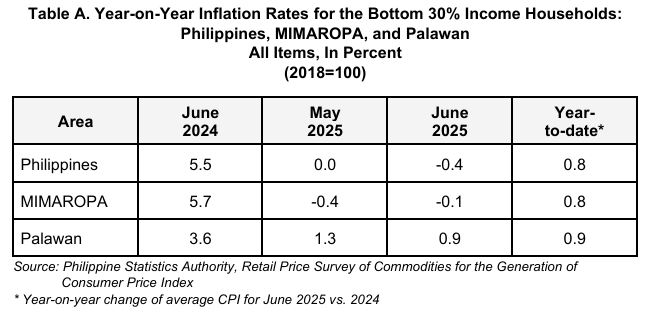
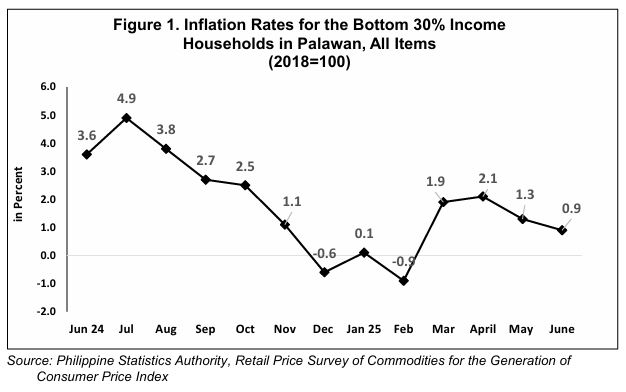
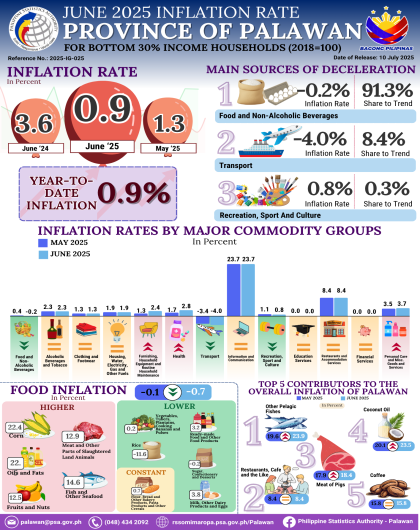
Palawan’s inflation rate for the bottom 30% income households decelerated to 0.9 percent in June 2025 from 1.3 percent in May 2025. In June 2024, inflation rate was higher at 3.6 percent. (Table A and Figure 1).
The main driver to the downward trend in the Provincial inflation for this income group in June 2025 was the lower year-on-year growth in the heavily weighted Food and Non-alcoholic Beverages at a decline of 0.2 percent from 0.4 percent, Transport at a decline of 4.0 percent from an annual decline of 3.4 percent, and Recreation, Sport, and Culture at 0.8 percent from 1.0 percent.
In contrast, higher annual growth rates were noted in the indices of Furnishings, Household Equipment and Routine Household Maintenance at 2.4 percent from 1.3 percent, Health at 2.8 percent from 1.7 percent, and Personal Care, and Miscellaneous Goods and Services at 3.7 percent from 3.5 percent.
Meanwhile, the indices of the following commodity groups remained unchanged from their previous month’s levels;
a) Alcoholic beverages and tobacco at 2.3 percent;
b) Clothing and footwear at 1.3 percent;
c) Housing, Water, Electricity, Gas and other fuels at 1.9 percent;
d) Information and Communication at 23.7 percent;
e) Education Services at 0.0 percent;
f) Restaurants and Accommodation Services at 8.4 percent; and
g) Financial Services at 0.0 percent.
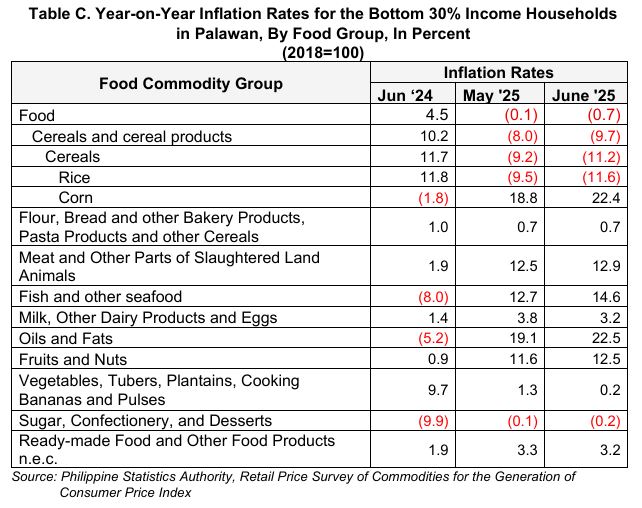
Food inflation for the bottom 30% income households in Palawan continue to decline at 0.7 percent from an annual decline of 0.1 percent in the previous month. In June 2024, the inflation was higher at 4.5 percent. (Table C)
The downtrend in the food inflation in the province was mainly due to the slower growth in the Cereals and Cereal Products at a decline of 9.7 percent from an annual decline of 8.0 percent, Vegetables, Tubers, Plantains, Cooking Bananas and Pulses at 0.2 percent from 1.3 percent, and Milk, Other Dairy Products and Eggs at 3.2 percent from 3.8 percent.
Moreover, lower inflation rates as compared with the previous month were also recorded in the indices of the following commodity groups;
a) Ready-made Food and Other Food Products n.e.c., 3.2 percent from 3.3 percent; and
b) Sugar, Confectionery, and Desserts, -0.2 percent from -0.1 percent.
Meanwhile, the indices in Meat and other parts of slaughtered land animals, Fish and other seafood, Oils and Fats, and Fruits and nuts recorded faster annual rates in June 2025 at 12.9 percent, 14.6 percent, 22.5 percent and 12.5 percent, consecutively.
DONNA MARIE D. MOBE
(Supervising Statistical Specialist)
Officer-in-Charge
Provincial Statistical Office Palawan
MQV/MDO
")
")
")