

Release Date :
Reference Number :
2024SR-02-006
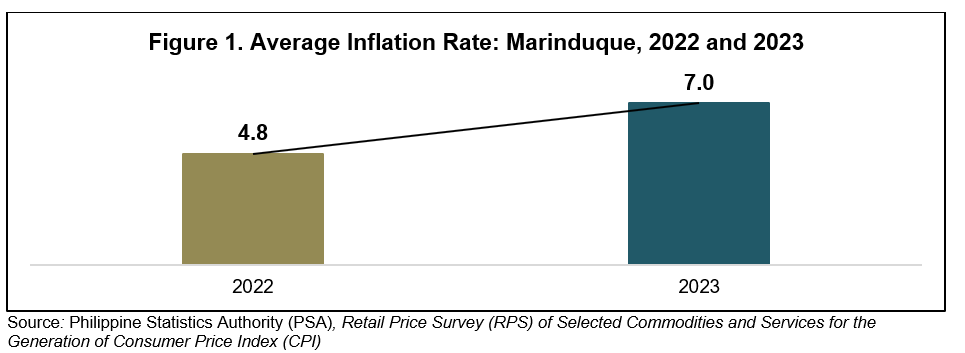
Marinduque experienced higher inflation rates in 2023
The average inflation rate for Marinduque in 2023 was 7.0 percent, reflecting a substantial 2.2 percentage points increase from the 4.8 percent average in 2022. (Figure 1)
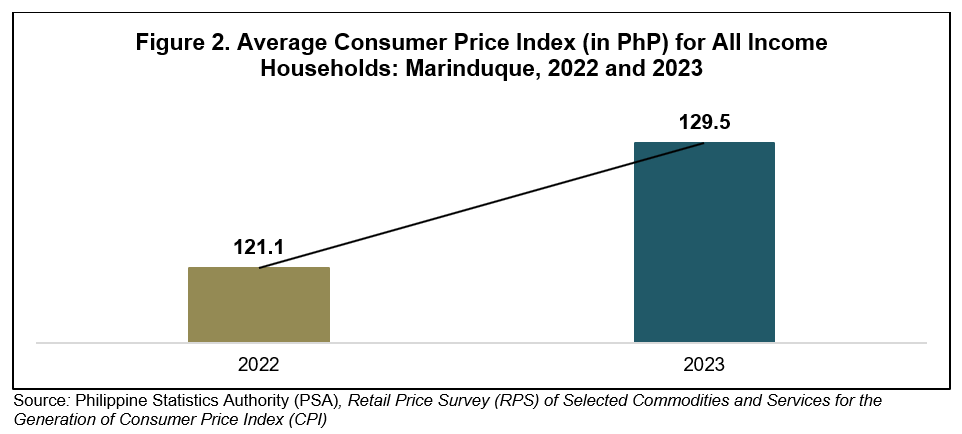
The Average Consumer Price Index (CPI), on the other hand, exhibited a notable increase of 7.0 percent, which is also equivalent to the average inflation rate as shown in Figure 1, as it rose from PhP121.1 in 2022 to PhP129.5 in 2023. This reflects a rise in the average prices of a fixed basket of goods and services commonly purchased by households relative to a base year, 2018. (Figure 2)
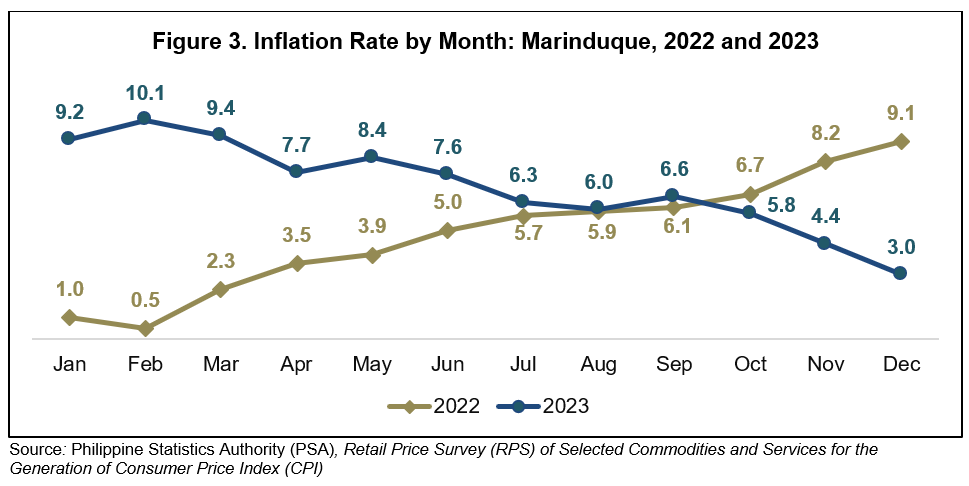
In 2023, Marinduque experienced fluctuating monthly inflation rates, peaking at 10.1 percent in February—a notable increase from the 9.1 percent peak observed in December 2022. Subsequently, a general decreasing trend ensued, reaching a low of 3.0 percent in December 2023. This contrasted with the lowest rate of 0.5 percent recorded in February 2022. Interestingly, the month of February displayed a reverse pattern between the two years, having the lowest inflation rate in 2022 and the highest in 2023. (Figure 3)
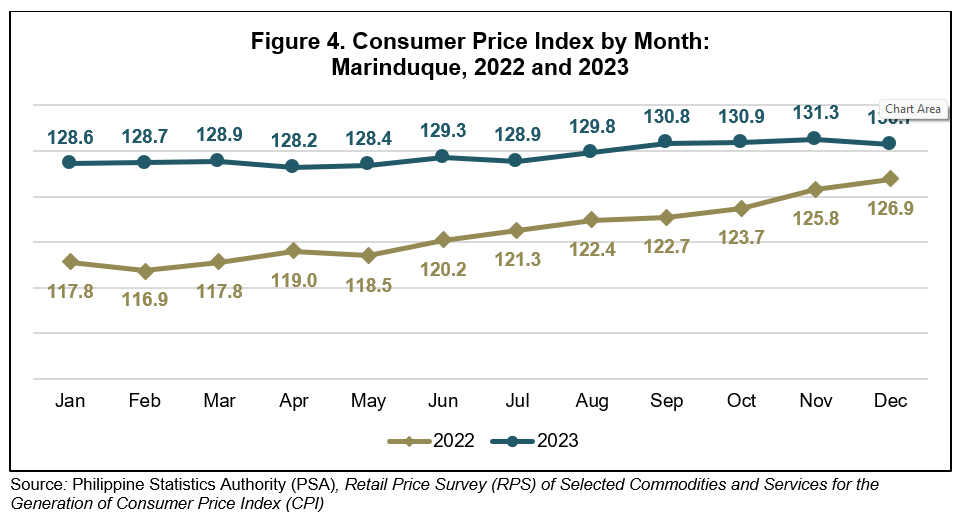
The Consumer Price Index (CPI) for Marinduque increased consistently throughout 2022 and 2023, reflecting changing price levels. In 2022, the CPI started at 117.8 in January and steadily rose to 126.9 by December. The upward trend continued into 2023, with the CPI reaching 130.7 by December. The corresponding inflation rates for each month in 2023, when compared to the same month in the previous year, ranged from PhP3.8 in December to a peak of PhP10.8 in February. These figures indicate varying degrees of inflation, with the highest rates occurring early in 2023 and gradually tapering off towards the end of the year. (Figure 4)
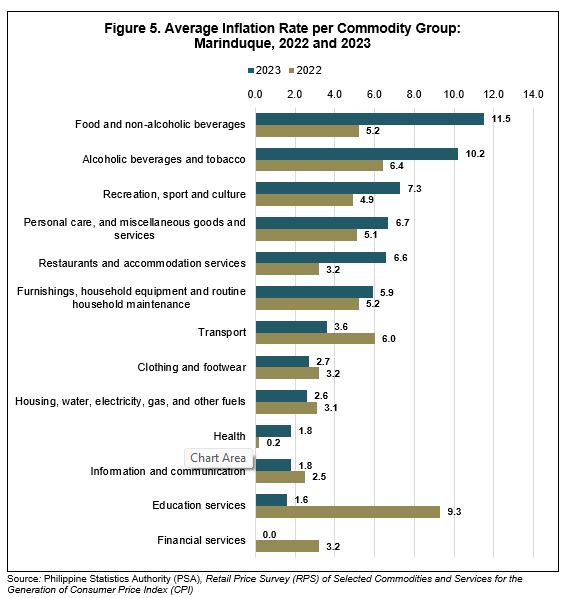
The average inflation rates for various commodity groups in Marinduque likewise showed notable changes between 2022 and 2023. Essential items, such as Food and Non-Alcoholic Beverages, experienced a substantial increase of 6.3 percentage points from 5.2 percent in 2022 to 11.5 percent in 2023. Similarly, Alcoholic Beverages and Tobacco saw a significant 3.8 percentage points hike. Recreation, Sport, and Culture also displayed a noticeable increase of 2.4 percentage points. On the contrary, some commodity groups, like Education Services, saw a considerable decrease in inflation, with 7.7 percentage points. Additionally, Financial Services showed no inflation in 2023, as opposed to 3.2 percent in 2022. (Figure 5)
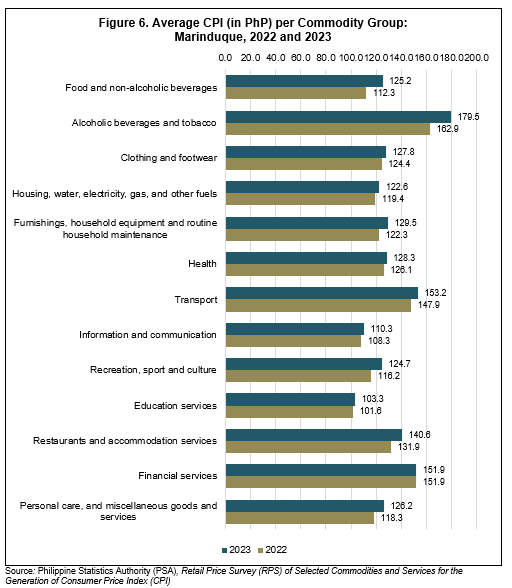
Moreover, the Average CPI per commodity group in Marinduque exhibited varied trends between 2022 and 2023. Notable were observed in several commodity groups which include increases in the average CPI for alcoholic beverages and tobacco (PhP16.6 or 10.19 percent), food and non-alcoholic beverages (PhP12.9 or 11.49 percent), and Restaurants and Accommodation Services (PhP8.7 or 6.60 percent). On the other hand, some commodity groups experienced relatively modest changes in the average CPI such as the Education Services (PhP1.7 or 1.67 percent) and Information and Communication (PhP2.0 or 1.85 percent). (Figure6)
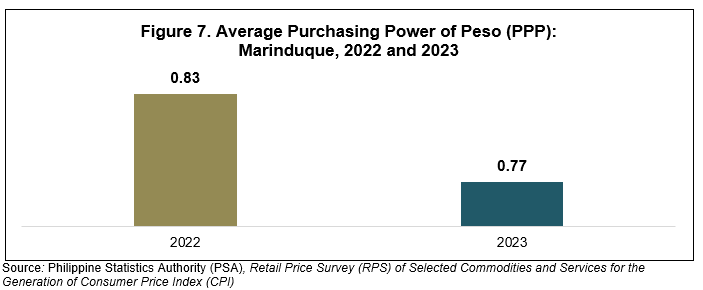
The Average Purchasing Power of the Peso (PPP) in Marinduque declined from PhP0.83 in 2022 to PhP0.77 in 2023. This decline signifies a decrease in the purchasing power of the currency, indicating a potential reduction in the overall economic ability to buy goods and services within the province when compared to the base year, 2018. (Figure 7)
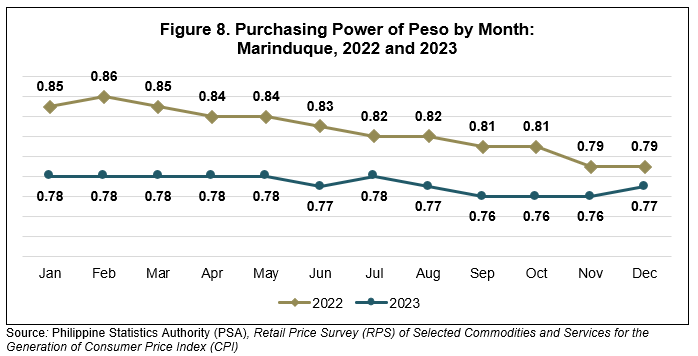
The PPP in Marinduque exhibited fluctuations in 2022 and 2023. In 2022, the PPP ranged from its highest at PhP0.86 in February to its lowest at PhP0.79 in November and December. The fluctuations continued into 2023, with values oscillating between PhP0.76 and PhP0.78. (Figure 8)
(SGD)GEMMA N. OPIS
Chief Statistical Specialist
| Attachment | Size |
|---|---|
|
|
145.87 KB |