

Release Date :
Reference Number :
2025-SR-050
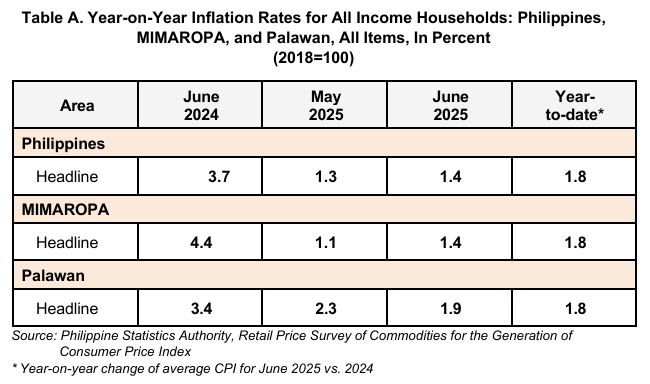
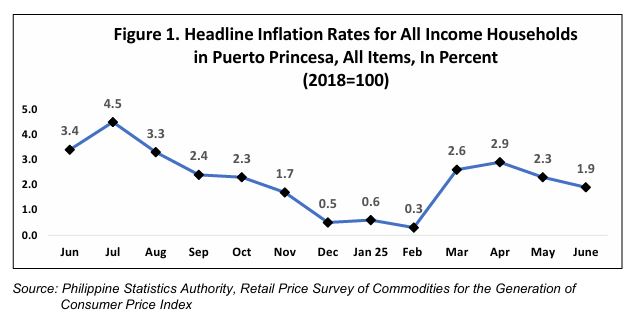
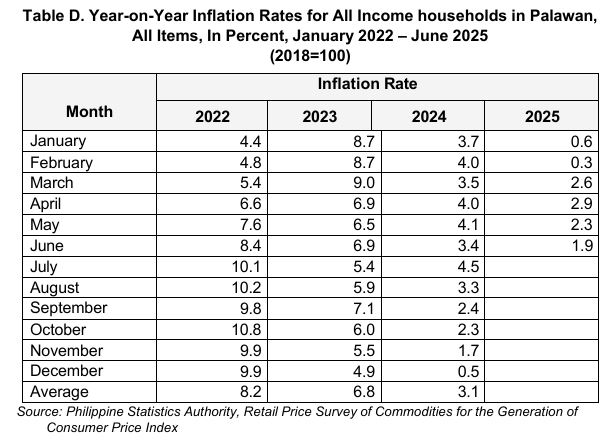
The headline inflation in the province of Palawan decelerated to 1.9 percent in June 2025, from 2.3 percent in the previous month. In June 2024, the inflation rate was recorded at 3.4 percent. (Table A and Figure 1)
The downtrend in provincial inflation during the month was primarily driven by the heavily weighted Food and non-alcoholic beverages sector, which recorded a lower inflation rate of 0.9 percent, down from 1.6 percent in May 2025. This was followed by Housing, Water, Electricity, Gas, and other Fuels, with an inflation rate of 2.4 percent from 2.9 percent in the previous month. The third primary contributor to the decline was Transport, which registered a decline of 2.6 percent in June 2025, down from an annual decline of 1.8 percent in the previous month. (Table B.)
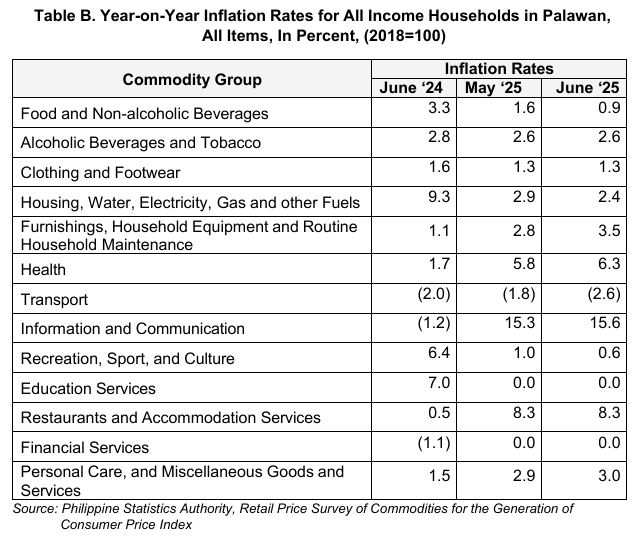
Meanwhile, higher inflation rates were observed in the indices of Furnishings, Household Equipment and Routine Household Maintenance at 3.5 percent in June 2025 from 2.8 percent in the previous month; Health at 6.3 percent from 5.8 percent; Information and Communication at 15.6 percent from 15.3 percent; Personal Care, and Miscellaneous Goods and Services at 3.0 percent from 2.9 percent. On the other hand, Alcoholic Beverages and Tobacco, Clothing and Footwear, Education Services, Restaurants and accommodation services, and Financial Services retained their June 2025 rates.
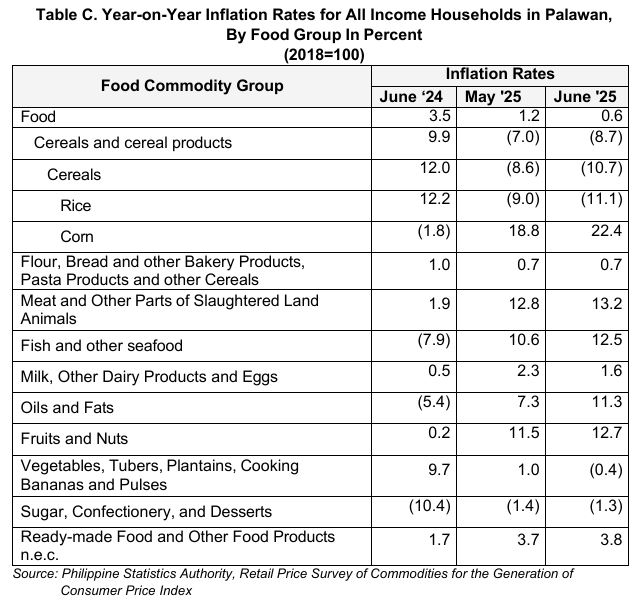
Food index for June 2025 in Palawan decelerated to 0.6 percent inflation rate from 1.2 percent in the previous month. In June 2024, the food index was higher at 3.5 percent inflation rate (Table C).
The downtrend in food inflation for the month was brought about by the lower index of Cereals and cereal products at a decline of 8.7 percent inflation rate during the month from an annual decline of 7.0 percent, Vegetables, tubers, plantains, cooking bananas and pulses at a decline of 0.4 percent inflation rate from 1.0 percent last month. This was followed by Milk, Other Dairy Products and Eggs at 1.6 percent in the current month from 2.3 percent during the past month.
In contrast, higher annual growth rates were also noted in the following groups:
a. Meat and Other Parts of Slaughtered Land Animals, 13.2 percent, from 12.8 percent;
b. Fish and other seafood, 12.5 percent from 10.6 percent,
c. Oils and Fats, 11.3 percent from 7.3 percent;
d. Fruits and Nuts, 12.7 percent from 11.5 percent;
e. Sugar, Confectionery, and Desserts, -1.3 percent from -1.4 percent, and
f. Ready-made Food and Other Food Products n.e.c., 3.8 percent from 3.7 percent.
Meanwhile, Flour bread and other bakery products pasta products and other cereals retained their previous month's levels.
DONNA MARIE D. MOBE
(Supervising Statistical Specialist)
Officer-in-Charge
Provincial Statistical Office Palawan
MQV/DCE
| Attachment | Size |
|---|---|
|
|
502.6 KB |