

Release Date :
Reference Number :
2024-SR-24
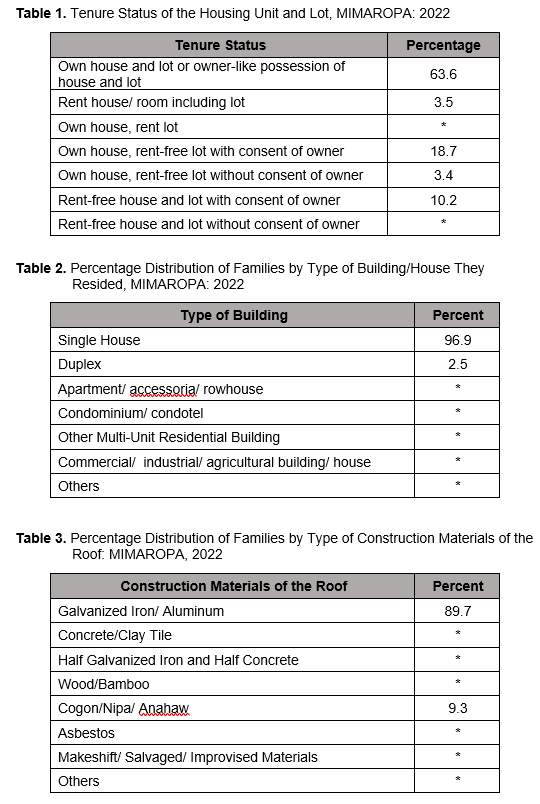
Three in every five families owned house and lot
Out of 803,000 families in the MIMAROPA region, 63.6 percent owned the house and lot they occupied based on the results of the 2022 Annual Poverty Indicators Survey (APIS). Families who occupied a house they owned in rent-free lot with the consent of the owner accounted to 18.7 percent and 10.2 percent owned house in rent-free lot without consent of the owner. The lower percentage had tenure status of rented house/room including a lot (3.5%) and owned house in rent-free lot without consent of the owner (3.4%).

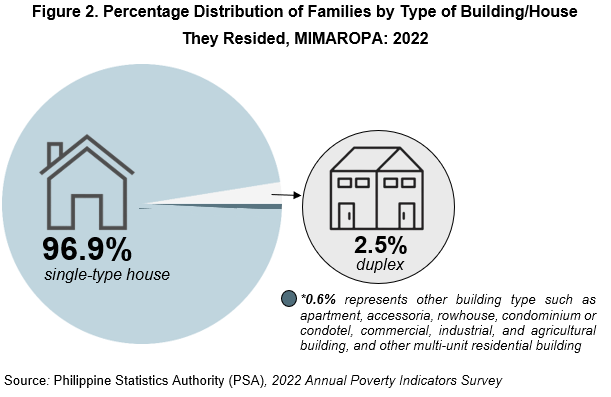
Most families in MIMAROPA resides in a single-type house
A single house is a complete structure intended for a single family or household like bungalow, 2-storey house, and nipa hut, while duplex house is a structure intended for two households, with complete living facilities for each. In addition, a duplex is a single structure divided into two dwelling units by a wall extending from the floor to the ceiling.
According to the 2022 APIS, the majority or 96.9 percent of families in the MIMAROPA region lived in a single-type of building or housing unit, while 2.5 percent of families resides in a duplex type of building or housing unit.
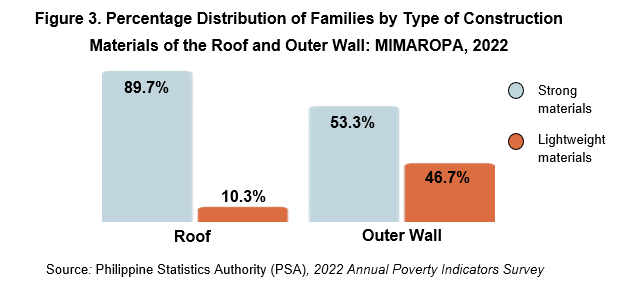
Roof and outer walls of houses in MIMAROPA were made up of strong materials
In 2022, most roofs of constructed houses were made of galvanized/iron/aluminum at 89.7 percent higher than the 2020 APIS result at 85.8 percent. About 9.3 percent of the families lived in houses with roofs made of cogon/nipa/anahaw materials, this is a lower percentage compared to the recorded 10.7 percent in 2020.
Moreover, more than half of the number of families had concrete/brick/stone as housing materials for outer walls at 53.3 percent, followed by wood (9.8%) and half concrete/brick/stone and half wood (9.5%). One-fourth of the houses in MIMAROPA had bamboo/sawali/cogon/nipa (25.6%) as their outer wall. Therefore, the roof and outer walls of houses in the region used strong materials than lightweight materials.
Strong materials for the roof refer to the construction materials of roof made of galvanized iron/aluminum or concrete/clay tile or half galvanized iron and half concrete while lightweight materials were those made up of wood/bamboo, cogon/nipa/anahaw, asbestos, makeshift/salvaged/improvised materials, and others. On the other hand, strong materials for the outer walls refer to the construction materials of outer walls made of concrete brick/stone or half concrete brick/stone and half wood or galvanized iron/aluminum, while lightweight materials were those constructed using of wood/bamboo, sawali/cogon/nipa, asbestos, makeshift/salvaged/improvised materials, or none.
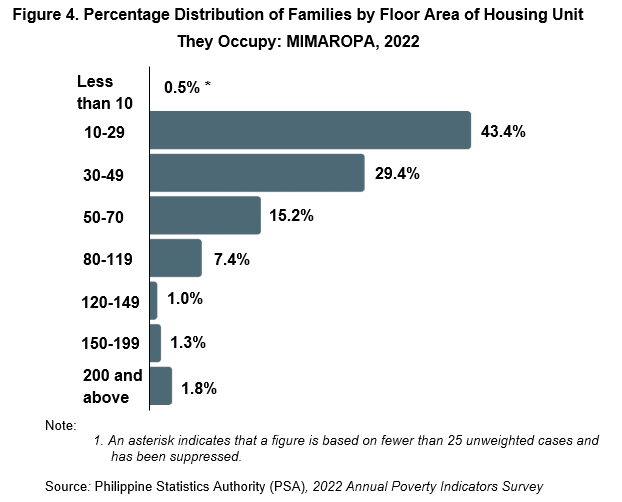
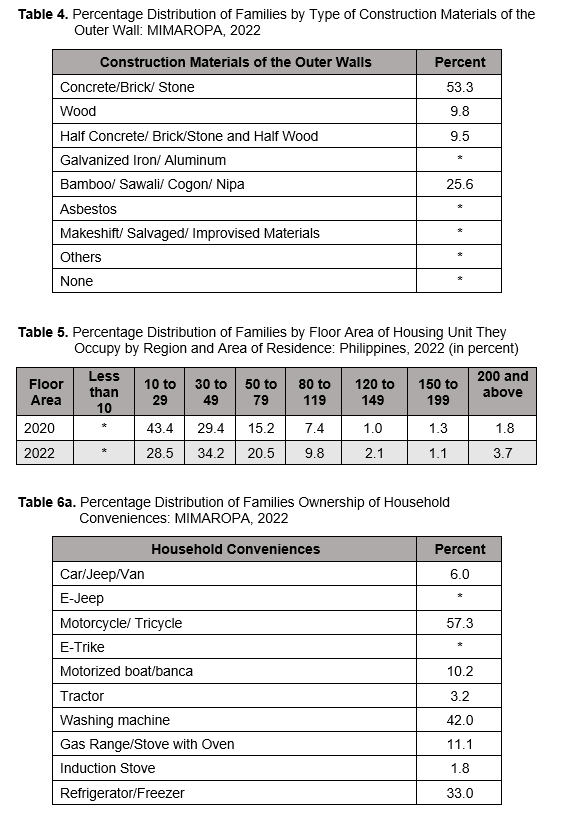
Forty-three percent of families in MIMAROPA lived in houses with floor area of less than 30 square meters
About four out of ten families (43.4%) were residing in housing units with floor area of less than 30 square meters, a higher percentage compared to the recorded 28.5 percent of families occupying housing units with floor area of less than 30 square meters in 2020. Furthermore, nearly one-third (29.4%) of families resided in housing units with floor area of 30 to 49 square meters, while the remaining 27.2 percent represents families who lived in a housing unit with atleast 50 square meters floor area.
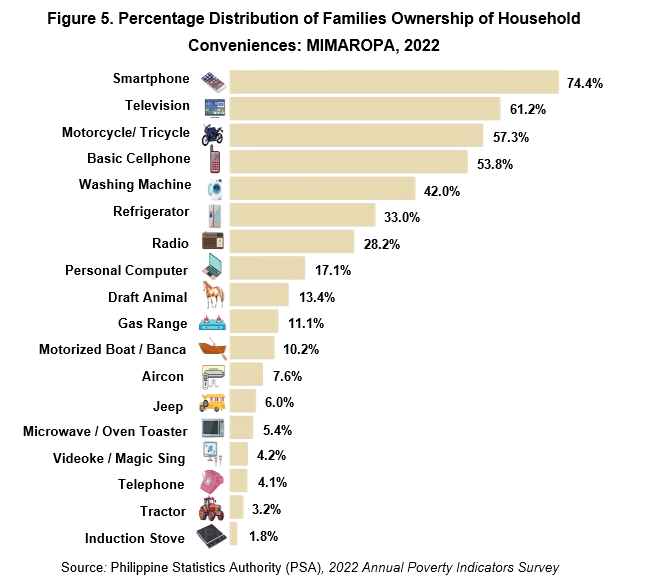
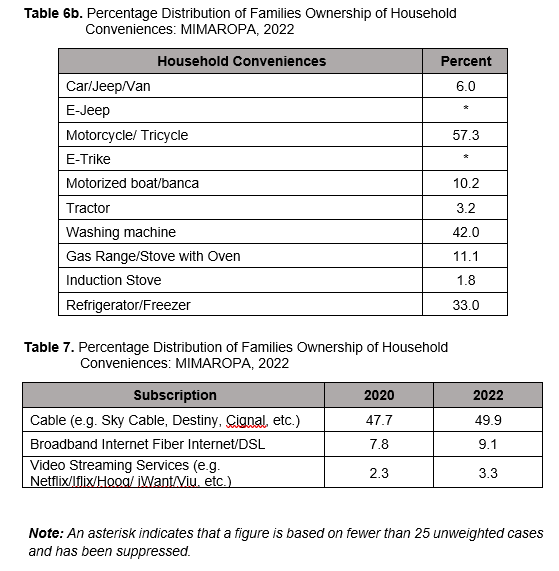
Smartphones were the most common household device present in MIMAROPA
Based on household responses in the 2022 APIS regarding the presence of household conveniences/devices in their housing unit, smartphones posted the highest percentage at 74.4, followed by television sets at 61.2 percent, and motorcycle/tricycle at 57.3 percent.
The result of the 2022 APIS displayed an almost similar trend from 2020, wherein cellular phones, comprised of smartphones and basic cellphones, topped the household conveniences/devices at 88.9 percent, followed by television sets at 70.0 percent, and motorcycle/tricycle at 55.8 percent.
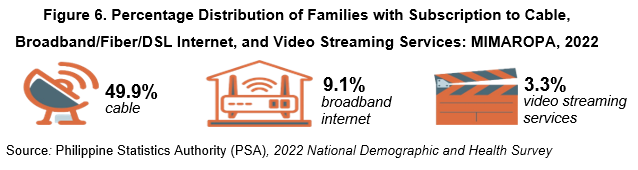
Almost half of the households in MIMAROPA subscribed to cable
Also, based on the 2022 APIS collected data, subscription to cable of families in MIMAROPA posted 49.9 percent, broadband internet at 9.1 percent and, and to video streaming services at 3.3 percent during the period of January to June 2022. The subscriptions to cable, broadband internet, and video streaming services were higher than the recorded subscriptions in 2020 at 47.7, 7.8, and 2.3 percent, respectively.
Technical Notes
The Annual Poverty Indicators Survey (APIS) is a household-based survey to provide information on the different indicators related to poverty that can be used to monitor the poverty situation in the country. The APIS is undertaken during the years when the Family Income and Expenditure Survey (FIES) is not conducted. Moreover, APIS is a rider survey to the July Labor Force Survey (LFS) round.
The 2022 APIS is the fourteenth in a series of poverty indicators survey conducted nationwide since 1998. The APIS is designed to provide estimates for non-income indicators related to poverty and serve as inputs in the Multi-dimensional Poverty Index (MPI) development.
Specifically, it gathers information on indicators that are correlated with poverty in order to determine the percent distribution of families in relation to the following indicators:
a. owner-like possession of house and lot and type of materials for the roof, outer walls, and floor materials of the housing unit;
b. type of toilet and handwashing facility, main source of water supply, and source of drinking water used by the family;
c. ownership of household conveniences;
d. children 6-11 years old enrolled in Grade 1 to Grade 6;
e. children 12-17 years old enrolled in junior high school (Grade 7 to Grade 10);
f. who availed loan/s and its sources;
g. who received and availed selected social protection programs; and
h. access to government services.
The 2022 APIS had a national sample of approximately 44,000 sample households deemed sufficient to provide reliable estimates at the national and regional levels. These sample housing units/households are selected from the 2013 Master Sample (MS) for household-based surveys of the PSA.
The reporting unit is the household, which means that the statistics emanating from this survey will refer to the characteristics of the population residing in private households. Persons who reside in the institutions are not within the scope of the survey.
The data collection of the 2022 APIS ran for 21 days from 08 to 30 July 2022. In this round of the APIS, Computer Aided Personal Interviewing (CAPI) using Tablet devices was utilized during data collection. The statistical researchers visited the sample housing units and interviewed the eligible respondents. The eligible respondent is the household head or the spouse of the head. In the absence of the household head or of his/her spouse, the respondent can be any responsible adult member who can provide reliable answers to questions asked by the survey interviewer about the household and its members.
The 2022 APIS, being a household-based survey, used the 2013 Master Sample (MS) of which 4 replicates equivalent to a total of 42,768 Secondary Sampling Units (SSUs) or sample housing units were selected as samples. Using a two-stage cluster sampling design, Enumeration Areas (EAs)/barangays were selected at the initial sampling stage as the Primary Sampling Units (PSUs), while the housing units within the selected PSUs were selected as the SSUs. Generally, all households within the sample housing unit were also considered as sample households. However, for housing units with more than three (3) households, a maximum of three (3) sample households were randomly selected.
(SGD) LENI R. RIOFLORIDO
Regional Director
OHG/EVC/MTYAD
| Attachment | Size |
|---|---|
|
|
3.64 MB |