

Release Date :
Reference Number :
2024-SR-23
Table 1. Year-on-Year Inflation Rates (%) in the Philippines and MIMAROPA Region,
by Province/Highly Urbanized City (HUC)
(2018=100)
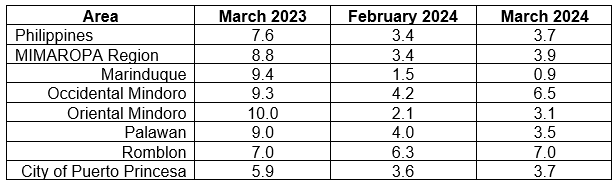
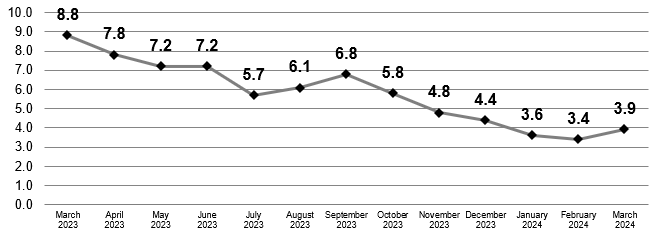
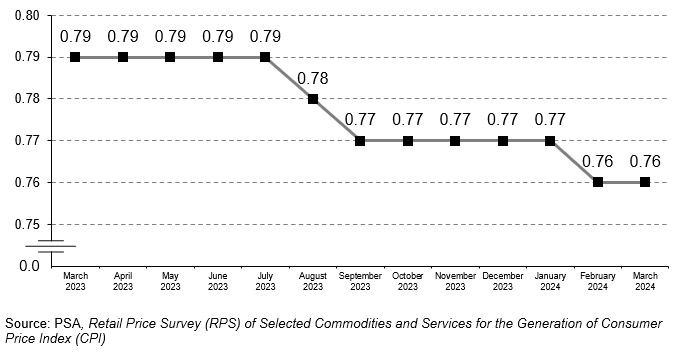
Figure 1. Year-on-Year Inflation Rates (%) in MIMAROPA:
March 2023 to March 2024
(2018=100)
Source: Philippine Statistics Authority (PSA), Retail Price Survey (RPS) of Selected Commodities and Services for the Generation of Consumer Price Index (CPI)
The headline inflation rate at the regional level increased to 3.9 percent in March 2024, from the 3.4 percent in the previous month. In the same reference month of the previous year, the index posted at 8.8 percent. The main contributors to the uptrend of inflation were food and non-alcoholic beverages, with 5.0 percent inflation; housing, water, electricity, gas and other fuels, with 3.8 percent inflation; and health, with 3.8 percent inflation.
INFLATION RATE BY COMMODITY GROUP
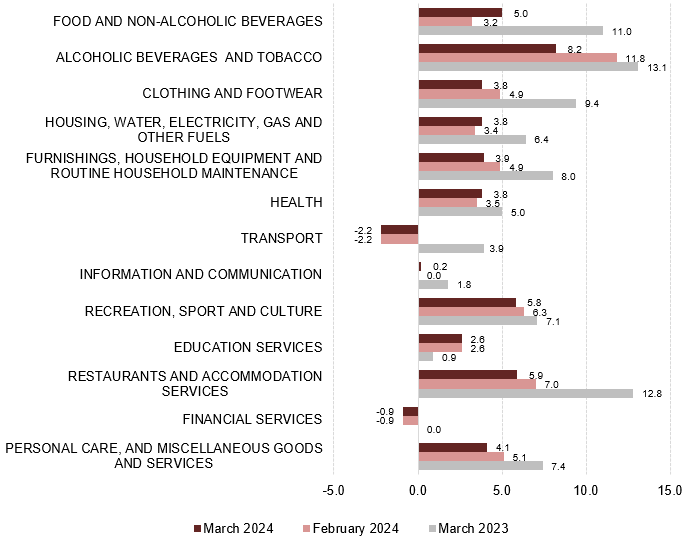
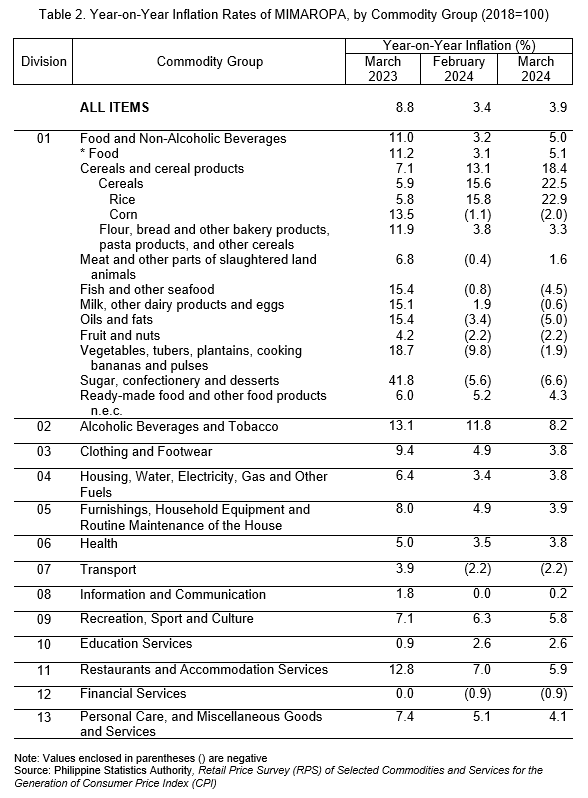
Figure 2. Year-on-Year Inflation Rates (%) in MIMAROPA,
by Commodity Group (2018=100)
Source: PSA, Retail Price Survey (RPS) of Selected Commodities and Services for the Generation of Consumer Price Index (CPI)
Moreover, a faster growth was observed for Information and Communication, with 0.2 percent inflation.
On the other hand, the following commodity groups exhibited a lower annual gain in March 2024:
• Alcoholic Beverages and Tobacco, 8.2%;
• Clothing and Footwear, 3.8%;
• Furnishings, Household Equipment and Routine Maintenance of the House, 3.9%;
• Recreation, Sport and Culture, 5.8%;
• Personal Care, and Miscellaneous Goods and Services, 4.1%; and
• Restaurants and Accommodations Services, 5.9%.
Meanwhile, the following commodity groups retained their previous month’s inflation rate:
• Transportation, -2.2%;
• Education Services, 2.6%; and
• Financial Services, -0.9%.
INFLATION RATE BY FOOD GROUP
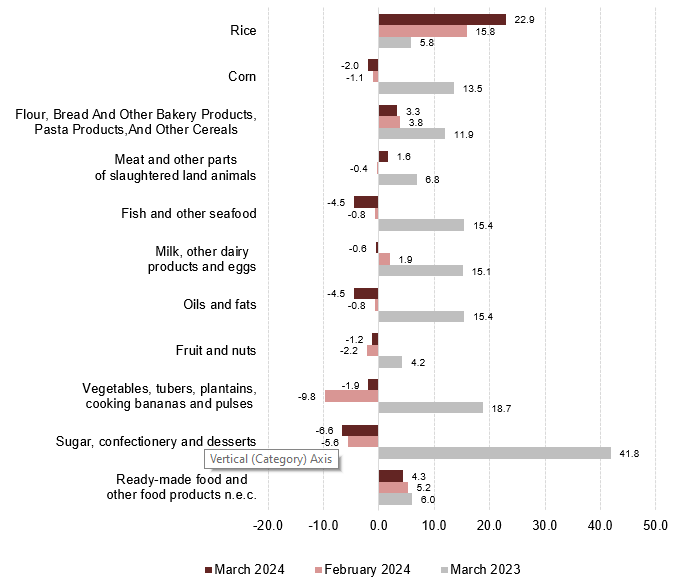
Figure 3. Year-on-Year Inflation Rates (%) in MIMAROPA,
by Food Group
(2018=100)
Source: PSA, Retail Price Survey (RPS) of Selected Commodities and Services for the Generation of Consumer Price Index (CPI)
The region’s food index accelerated to 5.1 percent in March 2024, from 3.1 percent in the previous month. In March 2023, the food inflation rate was higher at 11.2 percent. Moreover, the uptrend in March 2024 food index was mainly contributed by rice, at 22.9 percent inflation; vegetables, tubers, plantains, cooking bananas and pulses, -1.9 percent inflation; and meat and other parts of slaughtered land animals, 1.6 percent inflation.
PURCHASING POWER OF PESO
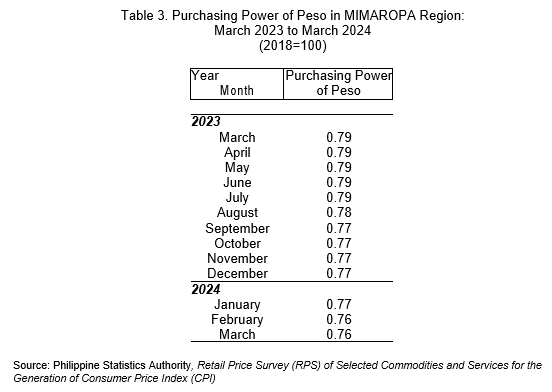
The Purchasing Power of Peso (PPP) in the MIMAROPA Region retained at Php 0.76 in March 2024. The PPP registered at Php 0.79 in March 2023. As a result, the amount of goods that can be presently purchased by consumers was fewer compared to when the PPP was higher.
Figure 4. Purchasing Power of Peso in MIMAROPA Region:
March 2023 to March 2024
(2018=100)
TECHNICAL NOTES
• Consumer Price Index is an indicator of the change in the average prices of a fixed basket of goods and services commonly purchased by households relative to a base year
• Market Basket is a sample of goods and services, which is meant to represent the totality of all the goods and services purchased by households relative to a base year.
o To determine the commodities that will form the market basket for the 2018-based CPI, the Survey of Key Informants (SKI) was conducted in March 2021. The survey, which was conducted nationwide to store managers, sellers or proprietors, obtained information on the most commonly purchased of goods and availed of services by the households.
o The commodities in the 2018-based CPI market basket are grouped/classified according to the 2020 Philippine Classification of Individual Consumption According to Purpose (PCOICOP) which is based on the United Nations COICOP. Meanwhile, the commodities in the 2012-based CPI market basket used the 2009 PCOICOP version of classification of commodities.
• Base year is a reference period, usually a year, at which the index number is set to 100. It is the reference point of the index number series. The CPI is rebased from base year 2012 to base year 2018.
• Inflation Rate is the annual rate of change or the year-on-year change in the Consumer Price Index (CPI).
• Purchasing Power of Peso is a measure of the real value of the peso in a given period relative to a chosen reference period. It is computed by getting the reciprocal of the CPI and multiplying the result by 100
Inflation Rate (reference month, reference year)
= [(CPI (reference month, reference year) - CPI (reference month, previous year)) / CPI (reference month, previous year)] x 100%
For example,
INFLATION RATE (March 2024) = [(CPI (March 2024) - CPI (March 2023)) / CPI (March 2023)] x 100%
= [(131.9 – 126.9) /126.9] x 100%
= (5.0 / 126.9) x 100%
≈ 3.9%
(SGD) LENI R. RIOFLORIDO
Regional Director
MLLM/OHG/APAR/JRCG
| Attachment | Size |
|---|---|
|
|
2.95 MB |