

Release Date :
Reference Number :
2025SR-06-030
INFLATION RATE FOR ALL INCOME HOUSEHOLDS
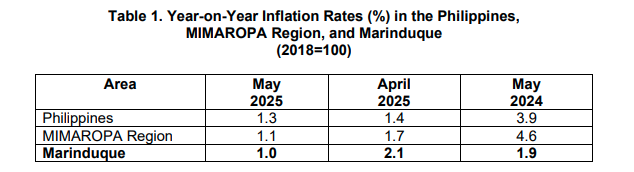
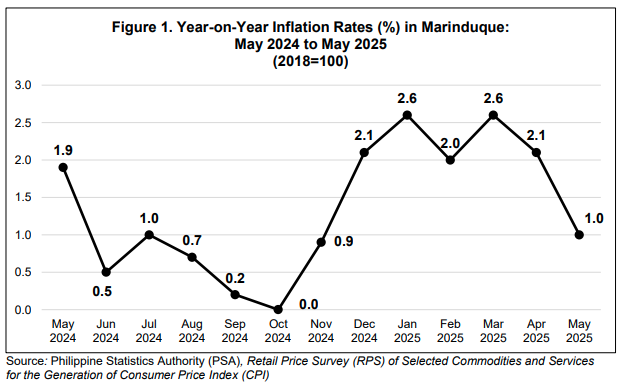
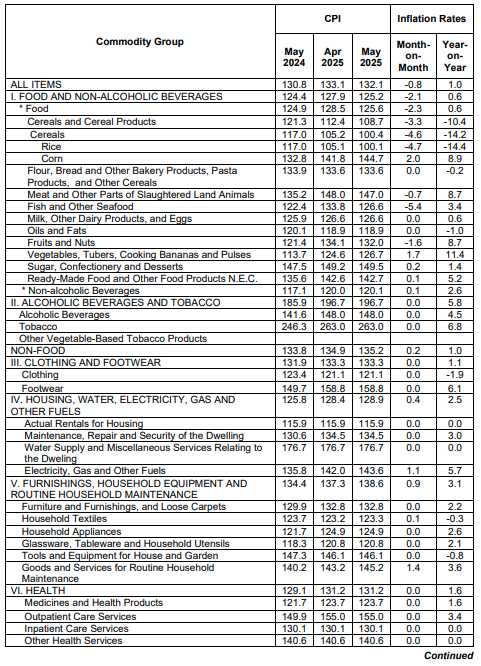
The headline inflation rate at the provincial level declined to 1.0 percent in May 2025, or a change of 1.1 percentage points from the inflation rate in the previous month. In the same reference month of the previous year, it was posted at 1.9 percent. The downtrend of inflation in May 2025 was mainly driven by the combined deceleration in the indices for selected commodity groups such as food and non-alcoholic beverages at 0.6 percent, housing, water, electricity, gas and other fuels at 2.5 percent, and information and communication at 0.1 percent.
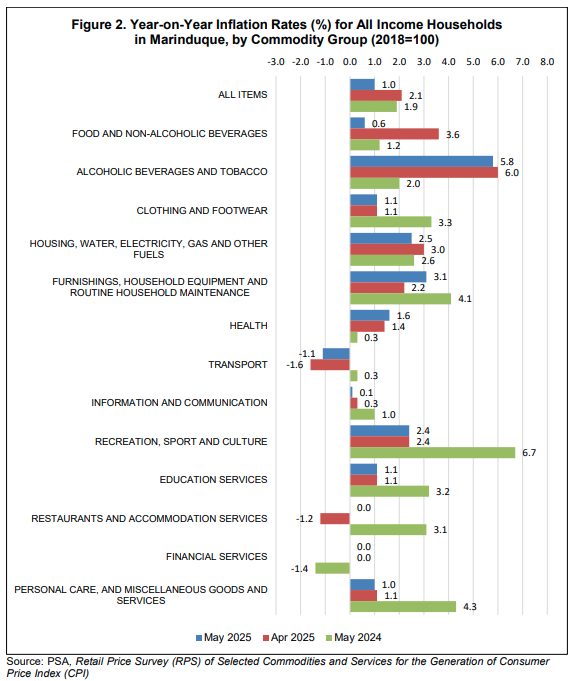
Furthermore, lower annual increment was also observed in the inflation rates for the personal care, and miscellaneous goods and services and alcoholic beverages and tobacco at 1.0 percent and 5.8 percent, respectively.
On the other hand, the annual indices of the following commodity groups showed higher growth compared to the previous month, as follows:
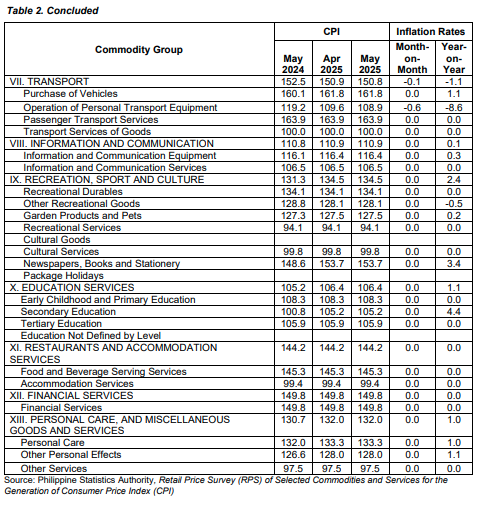
• Furnishings, household equipment and routine household maintenance, 3.1%;
• Health, 1.6%;
• Transport, -1.1%; and,
• Restaurants and accommodation services, 0.0%.
Meanwhile, the indices of the following commodity groups maintained compared with the annual figures from the previous month, as follows:
• Clothing and footwear, 1.1%;
• Recreation, sport and culture, 2.4%;
• Education services, 1.1%; and,
• Financial services, 0.0%.
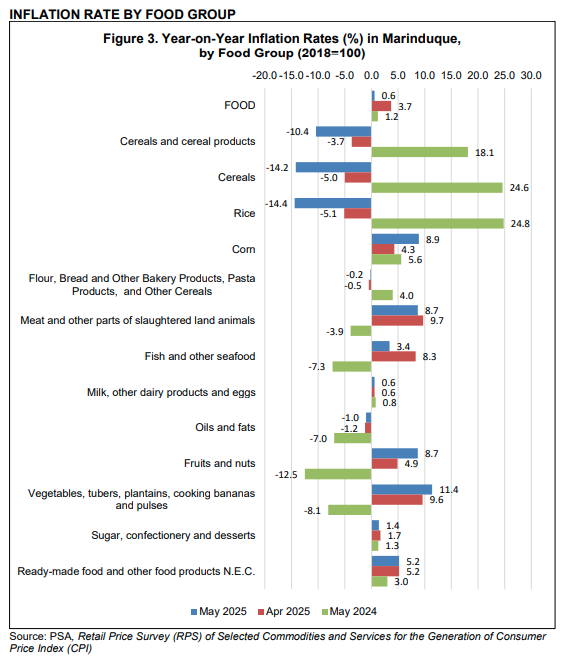
The province’s food index further decelerated to 0.6 percent in May 2025, from 3.7 percent in the previous month. This was equivalent to a change of 3.1 percentage points. In May 2024, the food inflation rate was lower at 1.2 percent.
The downtrend in food inflation was mainly due to the deceleration in the indices of rice at -14.4 percent, fish and other seafood at 3.4 percent, and meat and other parts of slaughtered land animals at 8.7 percent.
Furthermore, the annual index of the Sugar, confectionery and desserts exhibited lower growth when compared with the annual figure from the previous month, at 1.4 percent.
On the other hand, the annual indices of the following food items exhibited higher growth when compared with the annual figure from the previous month, as follows:
• Corn, 8.9%;
• Flour, Bread and Other Bakery Products, Pasta Products, and Other Cereals, -0.2%;
• Oils and fats, -1.0%;
• Fruits and nuts, 8.7%; and,
• Vegetables, tubers, plantains, cooking bananas and pulses, 11.4%.
Meanwhile, the annual index of the following food items remained the same when compared with the annual figure from the previous month, as follows:
• Milk, other dairy products and eggs, 0.6%; and,
• Ready-made food and other food products N.E.C., 5.2%.
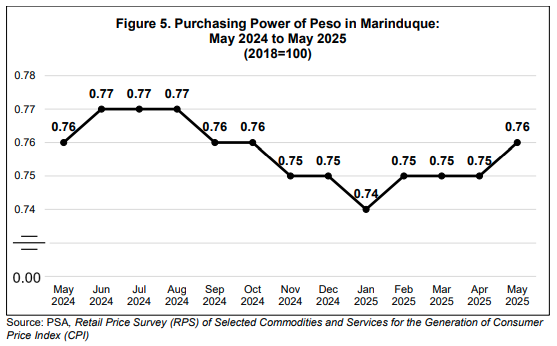
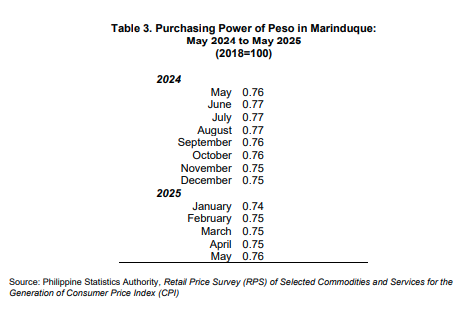
PURCHASING POWER OF PESO
The Purchasing Power of Peso (PPP) in Marinduque increased to PhP 0.76 in May 2025, same with PhP 0.76 in May 2024.
TECHNICAL NOTES
• Consumer Price Index is an indicator of the change in the average prices of a fixed basket of goods and services commonly purchased by households relative to a base year.
• Market Basket is a sample of goods and services, which is meant to represent the totality of all the goods and services purchased by households relative to a base year
To determine the commodities that will form the market basket for the 2018-based CPI, the Survey of Key Informants (SKI) was conducted in March 2021. The survey, which was conducted nationwide to store managers, sellers or proprietors, obtained information on the most commonly purchased goods and availed services by the households.
The commodities in the 2018-based CPI market basket are grouped/classified according to the 2020 Philippine Classification of Individual Consumption According to Purpose (PCOICOP) which is based on the United Nations COICOP. Meanwhile, the commodities in the 2012-based CPI market basket used the 2009 PCOICOP version of classification of commodities.
• Base year is a reference period, usually a year, at which the index number is set to 100. It is the reference point of the index number series. The CPI is rebased from base year
2012 to base year 2018.
• Inflation Rate is the annual rate of change or the year-on-year change in the Consumer Price Index (CPI).
• Purchasing Power of Peso is a measure of the real value of the peso in a given period relative to a chosen reference period. It is computed by getting the reciprocal of the CPI and multiplying the result by 100
Inflation Rate (reference month, reference year)
= [(CPI (reference month, reference year) - CPI (reference month, previous year)) / CPI (reference month, previous year)] x 100%
For example,
INFLATION RATE (May 2025) = [(CPI (May 2025) - CPI(May 2024)) / CPI(May 2024)] x 100%
= [(132.1 – 130.8) / 130.8] x 100%
= (1.3 / 130.8) x 100%
≈ 1.0%
Approved for Publication:
(SGD)GEMMA N. OPIS
Chief Statistical Specialist
PSA PSO Marinduque
Table 2. Consumer Price Index by Subgroup, Month-on-Month and Year-on-Year Percent
Changes in Marinduque
(2018=100)
| Attachment | Size |
|---|---|
|
|
406.67 KB |