

Release Date :
Reference Number :
2023-02
City of Puerto Princesa
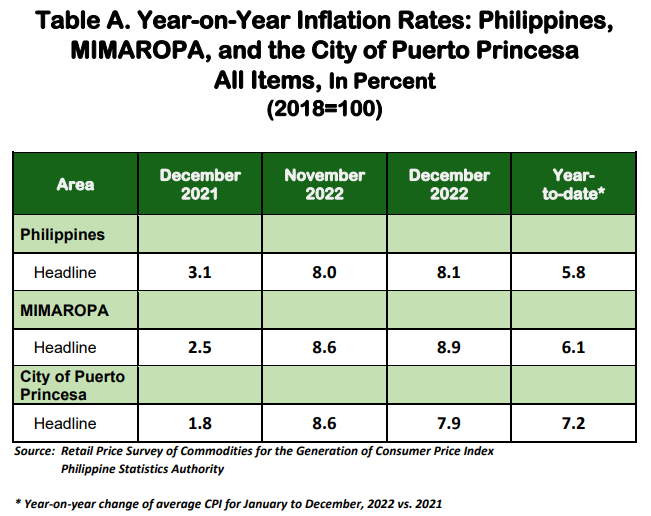
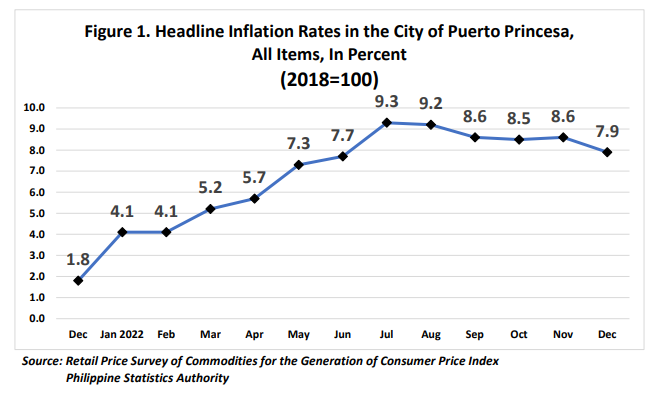
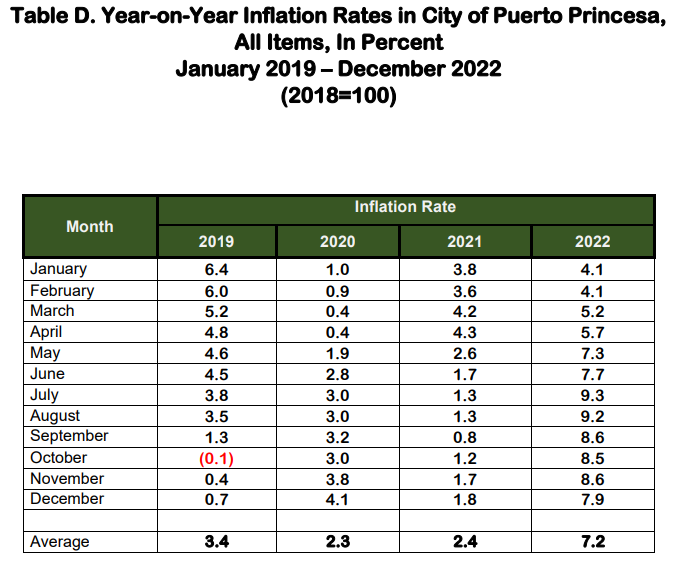
The headline inflation in the City of Puerto Princesa slowed down to 7.9 percent in December 2022, from 8.6 percent in November 2022. The average inflation for the 2022 stood at 7.2 percent. In December 2021, the headline inflation was lower, at 1.8 percent. (Table A and Figure 1)
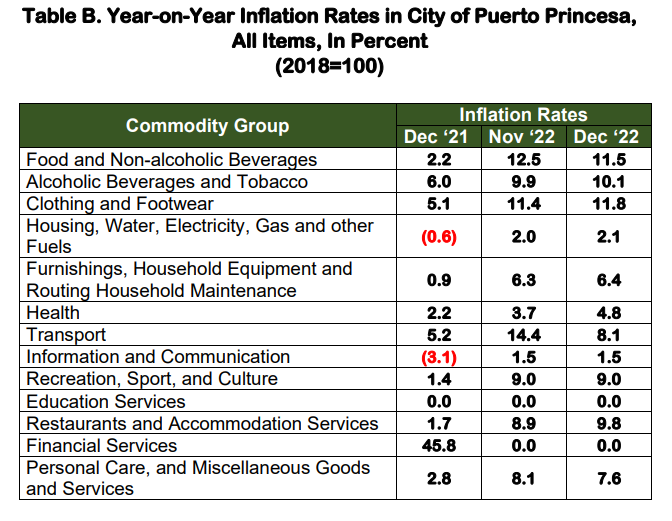
The slower pace was primarily due to the lower annual increment in the index of Transport at 8.1 percent from 14.4 percent in the previous month. This was followed by Food and Non-Alcoholic Beverages whose inflation rate eased to
11.5 percent, from the previous month’s 12.5 percent. Came third was Personal Care, and Miscellaneous Good and Services at 7.6 percent, lower than the November 2022 inflation rate of 8.1 percent. (Table B).
On the other hand, higher indices were observed in the following commodities:
a. Restaurants and Accommodation Services, 9.8 percent;
b. Housing, Water, Electricity, Gas and Other Fuels, 2.1 percent;
c. Clothing and Footwear, 11.8 percent;
d. Furnishings, Household Equipment and Routine Household Maintenance, 6.4 percent;
e. Alcoholic Beverages and Tobacco, 10.1 percent; and
f. Health, 4.8 percent.
Meanwhile, the rest of the commodity groups retained their previous month’s inflation rates.
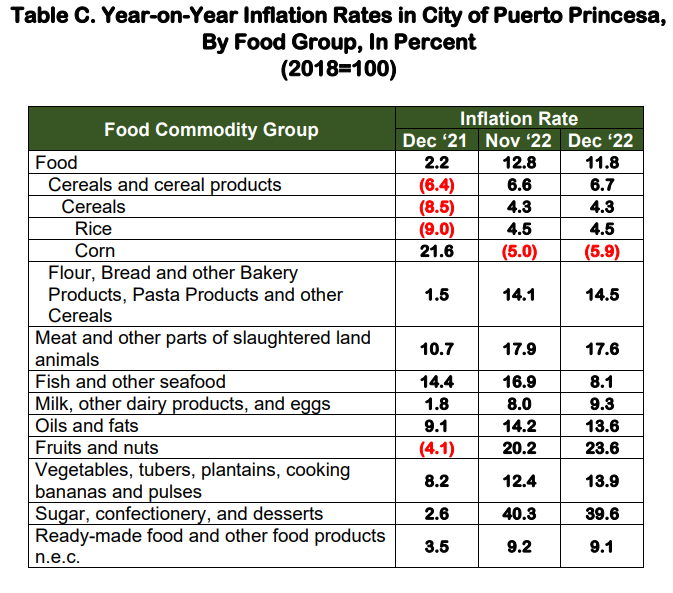
Food index for December 2022 was registered at 11.8 percent, lower than its previous month’s inflation rate of 12.8 percent. In December 2021, the food index was posted, at 2.2 percent (Table C).
During this period, the deceleration in the food index can be mainly attributed to the decline in Fish and Other Seafood at 8.1 percent, from 16.9 percent in the previous month. Furthermore, lower indices were observed in the following commodities:
a. Meat and Other Parts of Slaughtered Land Animals, 17.6 percent;
b. Sugar, Confectionery and Desserts, 39.6 percent;
c. Oils and Fats, 13.6 percent;
d. Ready-made Food and other Food Products n.e.c., 9.1 percent; and
e. Corn, -5.9 percent.
On the other hand, the following food commodity groups exhibited an increase in inflation rates:
a. Vegetables, Tubers, Plantains, Cooking Bananas and Pulses, 13.9
percent;
b. Flour, Bread and other Bakery Products, Pasta Products and other Cereals, 14.5 percent;
c. Milk, Other Dairy Products and Eggs, 9.3 percent; and
d. Fruits and Nuts, 23.6 percent.
Meanwhile, Rice retained its previous month’s inflation rate of 4.5 percent.

| Attachment | Size |
|---|---|
|
|
184.4 KB |