

Release Date :
Reference Number :
2023-SR-41
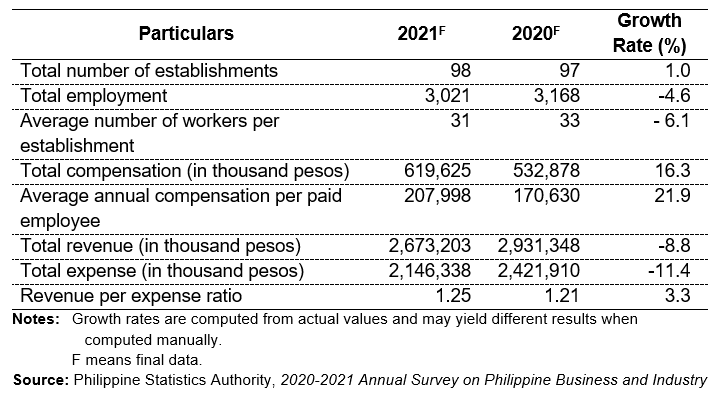
Table A. Comparative Statistics for Human Health and Social Work
Activities Section: MIMAROPA Region, 2021 and 2020
Medical and dental practice activities group had the most number of establishments in the human health and social work activities section
The Annual Survey of Philippine Business and Industry (ASPBI) final results showed that a total of 98 establishments in the formal sector of the economy were engaged in human health and social work activities in 2021. This represents an increase of 1.0 percent from the 97 establishments recorded in 2020. (Table A)
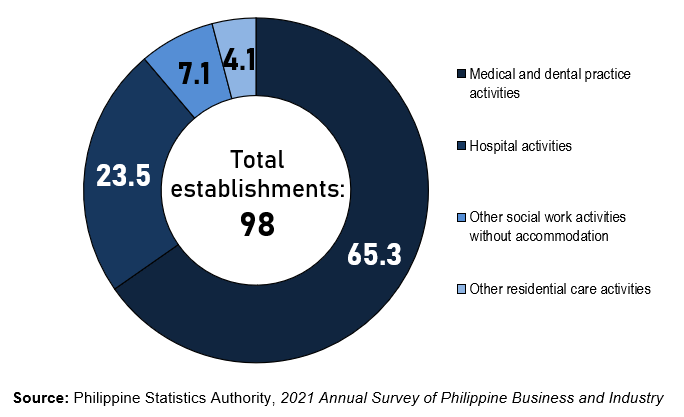
Among industry groups, medical and dental practice activities posted the highest number of 64 establishments (65.3%). This was followed by hospital activities with 23 establishments (23.5%), other social work activities without accommodation with 7 establishments (7.1%), and other residential care activities with 4 establishments (4.1%). (Figure 1 and Table 1)
Figure 1. Distribution of Establishments under Agriculture, Forestry, and Fishing Section by Industry Group: MIMAROPA Region, 2021
Hospital activities group employed the highest number of workers
The total employment in the human health and social work activities section of the MIMAROPA Region was recorded at 3,021 workers as of 15 November 2021. This indicates a decrease of 4.6 percent from the 3,168 workers reported on the same date in 2020.
Of the total workforce for the human health and social work activities section, 2,979 workers or 98.6 percent were paid employees, while the remaining were working owners and unpaid workers. (Table A and Table 1)
Table B. Employment by Type for Human Health and Social Work Activities Section: MIMAROPA Region, 2021
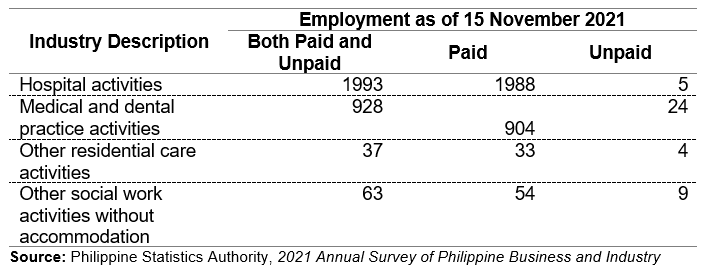
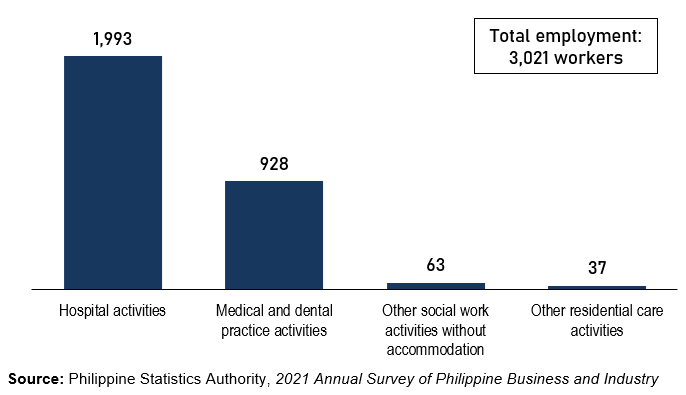
Among industry groups, hospital activities registered the highest employment of 1,993 workers and a 66.0 percent share to the total employment of the human health and social work activities section in the region. This was followed by medical and dental practice activities with a total of 928 workers (30.7%) and other social work activities without accommodation with a total of 63 workers (2.1%). (Figure 2)
Figure 2. Employment for Human Health and Social Work Activities Section by Industry Group: MIMAROPA Region, 2021
The human health and social work activities section recorded an average of 31 workers per establishment in 2021. This represents a 6.1 percent decline from the reported 33 workers per establishment in the previous year. (Table A and Table 2)
Among industry groups, hospital activities had the highest average employment of 87 workers per establishment. Moreover, this was the only industry group under the human health and social work activities section in the region that surpassed the regional employment per establishment ratio of 31 workers per establishment. Medical and dental practice activities followed with an average employment of 15 workers. Meanwhile, both other residential care activities and other social work activities industry groups recorded an average employment of 9 workers per establishment. (Table 2)
Hospital activities group paid the highest average annual compensation per paid employee
In 2021, the total compensation paid by the section to its employees amounted to PhP 619.63 million. This translates to an average annual compensation of PhP 207,998 per paid employee, which indicates a 21.9 percent decrease from the recorded average annual pay of PhP 170,630 per paid employee in 2020. (Table A)
Figure 3. Average Annual Compensation per Paid Employee by Industry Group in the Human Health and Social Work Activities Section: MIMAROPA Region 2021
(Average Annual Compensation in Thousand Philippine Pesos)
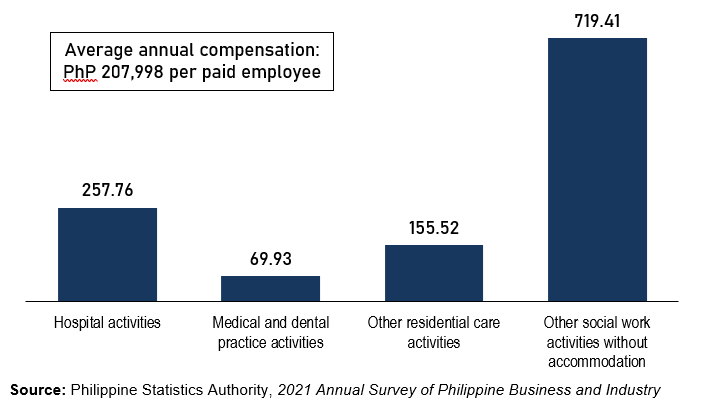
By industry group, employees from other social work activities without accommodation received the highest average annual compensation of PhP 719,407 per paid employee in 2021. This was followed by the average annual compensation per paid employee from hospital activities (PhP 257,763), other residential care activities (PhP 155,515), and medical and dental practice activities, (PhP 69,926). (Figure 3 and Table 2)
Hospital activities industry ground contributed the major share to the total revenue and total expense
The total revenue generated by the human health and social work activities section in 2021 reached PhP 2,673.20 million, indicating a decline of 8.8 percent from the PhP 2,931.35 million reported revenue in 2020. On the other hand, the total expense incurred by the section amounted to PhP 2,146.34 million in 2021, which shows an 11.4 percent decrease from the PhP 2,421.91 million total expense posted in 2020. (Figure 4, Table A, and Table 1)
Figure 4. Total Revenue and Total Expense for Human Health and Social Work Activities Section by Industry Group: MIMAROPA Region 2021
(Total Revenue and Total Expense in Million Philippine Pesos)
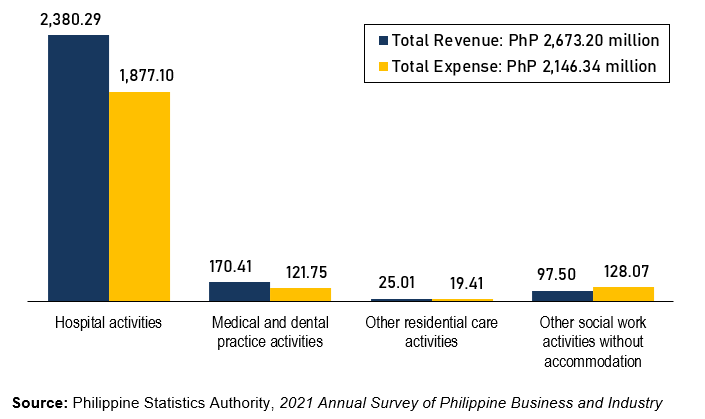
Among industry groups, hospital activities contributed the highest share to the human health and social work activities section’s total revenue amounting to PhP 2,380.29 million (89.0%) in 2021. It was followed by medical and dental practice activities, other social work activities without accommodation, and other residential care activities with a corresponding total revenue of PhP 170.41 million (6.4%), PhP 97.50 million (3.6%), and PhP 25.01 million (0.9%). (Figure 4 and Table 1)
In terms of expenses, the top spender was hospital activities industry group with PhP 1,877.10 million. This translates to an 87.5 percent share to the section’s total expenses. Other social work activities without accommodation, medical and dental practice activities, and other residential care activities came next with incurred total expenses of PhP 128.07 million (6.0%), PhP 121.75 million (5.7%), and PhP 19.41 million (0.9%), respectively. (Figure 4 and Table 1)
Medical and dental practice activities registered the highest revenue per peso expense ratio
In 2021, the revenue per peso expense ratio of the human health and social work activities section was recorded at 1.25, which reflects an increase of 3.3 percent from the recorded 1.21 revenue per expense ratio in 2020. This indicates that for every peso spent in 2021, the section generated a corresponding revenue of PhP 1.25. (Table A and Table 2)
By industry group, medical and dental practice activities registered the highest revenue per peso expense ratio of 1.40. Other residential care activities came second with a recorded revenue per peso expense ratio of 1.29. It was followed by hospital activities and other social work activities without accommodation with revenue per expense ratios of 1.27 and 0.76, respectively. Other social work activities without accommodation was recorded as the only industry group with a revenue per expense ratio that is lower than the regional level. (Table 2)
(SGD) LENI R. RIOFLORIDO
Regional Director
MLLM / OHG / LACB
| Attachment | Size |
|---|---|
|
|
2.18 MB |
|
|
3.49 MB |