

Release Date :
Reference Number :
2025-SR-015
Table A. Year-on-Year Inflation Rates: Philippines, MIMAROPA, and Palawan
All Items, In Percent
(2018 = 100)
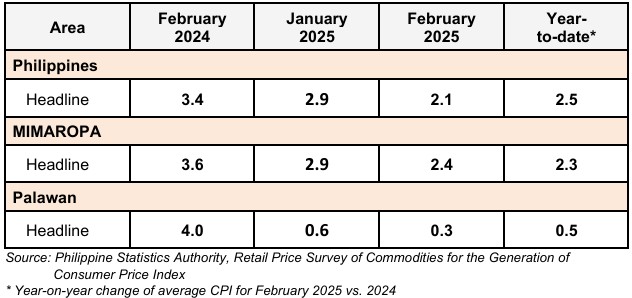
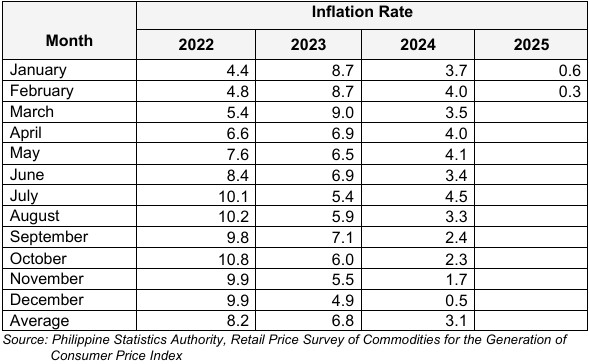
The headline inflation in the province of Palawan slightly decelerated at 0.3 percent in February 2025, from 0.6 percent in the previous month. In February 2024, inflation rate was recorded at 4.0 percent. (Table A and Figure 1)
The downtrend in the provincial inflation during the month was primarily brought by the lower index for Food and non-alcoholic beverages, with -1.7 percent inflation from 0.2 percent in January 2025. This was followed by Furnishings, household equipment and routine household maintenance, which posted an inflation rate of 3.0 percent from 3.7 percent. Also contributing to the acceleration is the lower increment of Alcoholic beverages and tobacco, which registered a 1.6 percent inflation rate from 2.3 percent in the previous month.
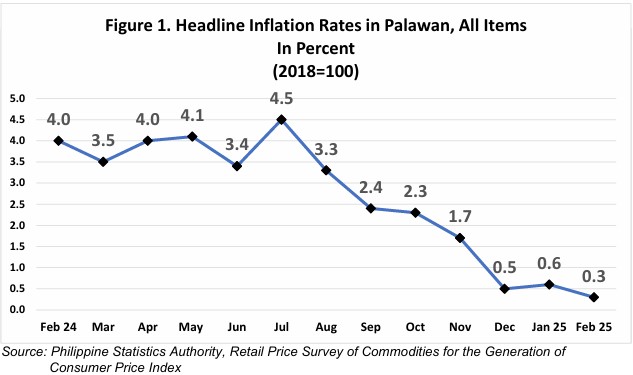
Table B. Year-on-Year Inflation Rates in Palawan
All Items, In Percent
(2018 = 100)
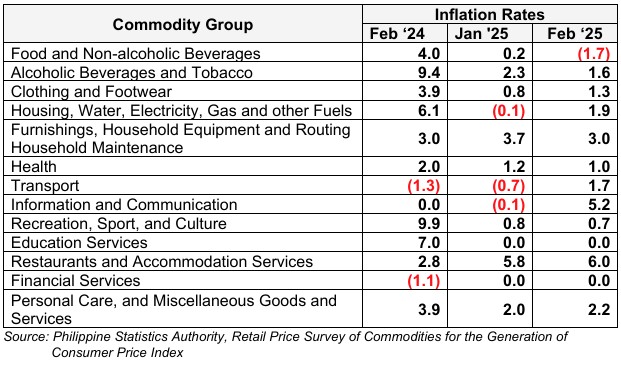
Meanwhile, higher inflation rates were observed in the indices of the following:
a) Clothing and footwear at 1.3 percent from 0.8 percent in the previous month;
b) Housing, water, electricity, gas, and other fuels at 1.9 percent from -0.1 percent;
c) Transport at 1.7 percent from -0.7 percent;
d) Information and communication with 5.2 percent from -0.1 percent;
e) Restaurants and accommodation services at 6.0 percent from 5.8 percent; and
f) Personal care and miscellaneous goods and services at 2.2 percent from 2.0 percent.
On the other hand, Education and Financial services retained its January 2025 levels at zero percent inflation.
Table C. Year-on-Year Inflation Rates in Palawan,
By Food Group, In Percent
(2018 = 100)
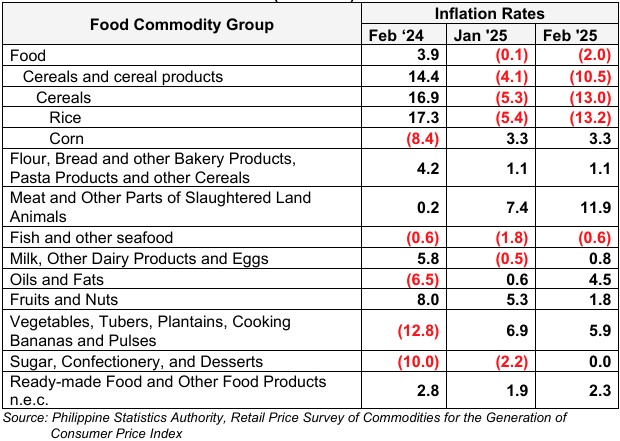
Food index for February 2025 further declined to -2.0 percent inflation rate from -0.1 percent in the previous month. In February 2024, the food index was higher, at 3.9 percent inflation rate. (Table C)
The slower food inflation for the month was brought about by the lower index for Cereals and cereal products at -10.5 percent inflation rate, from -4.1 percent last month. This was followed by Fruits and nuts at 1.8 percent inflation rate, from 5.3 percent. Vegetables, tubers, plantains, cooking bananas, and pulses also decreased at 5.9 percent from 6.9 percent in the previous month.
In contrast, higher inflation rates were observed in the following food groups:
a. Meat and other parts of slaughtered land animals, 11.9 percent from 7.4 percent;
b. Fish and other seafood, -0.6 percent from -1.8 percent;
c. Milk, other dairy products and eggs, 0.8 percent from -0.5 percent;
d. Oils and fats, 4.5 percent from 0.6 percent;
e. Sugar, confectionery and desserts, 0 percent from -2.2 percent; and
f. Ready-made food and other food products n.e.c., 2.3 percent from 1.9 percent.
Meanwhile, Corn and Flour, bread and other bakery products, pasta products, and other cereals retained its previous month’s inflation rate at 3.3 percent and 1.1 percent, respectively.
Table D. Year-on-Year Inflation Rates in Palawan,
All Items, In Percent
January 2022 – February 2025
(2018 = 100)
DONNA MARIE D. MOBE
(Supervising Statistical Specialist)
Officer-In-Charge
Palawan Provincial Statistical Office
MQV
| Attachment | Size |
|---|---|
|
|
669.29 KB |