

Release Date :
Reference Number :
2025-SR-017
Table A. Year-on-Year Inflation Rates for the Bottom 30% Income Households:
Philippines, MIMAROPA, and Puerto Princesa City
All Items, In Percent
(2018=100)
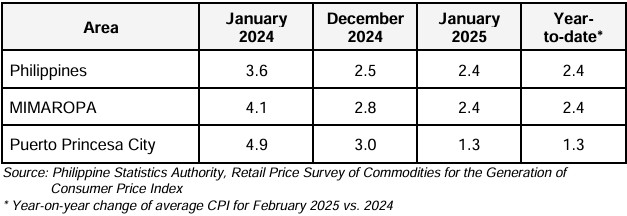
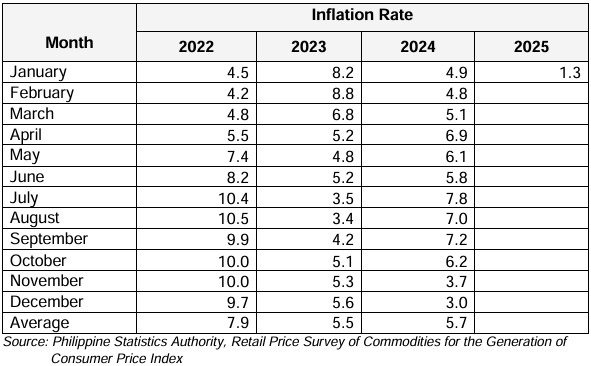
The inflation rate for the bottom 30% income households in Puerto Princesa City slowed down to 1.3 percent in January 2025 from 3.0 percent in December 2024. In January 2024, the inflation rate was posted at 4.9 percent. (Table A and Figure 1)
The downtrend in the inflation for the bottom 30% income households in January 2025 was primarily influenced by the lower year-on-year growth in the Housing, water, electricity, gas and other fuels at a decline of 2.0 percent during the month from 5.6 percent in December 2024. Likewise, the lower annual increases in the Food and non-alcoholic beverages index at 2.2 percent in January 2025 from 2.8 percent in the previous month, and Transport index registering a decline of 1.2 percent in January 2025 from 1.6 percent in the previous month also contributed to the downtrend in the overall inflation of Puerto Princesa City.
Moreover, lower inflation rates were noted in the indices of Alcoholic beverages and tobacco at 1.3 percent in January 2025 from 1.9 percent in December 2024; Furnishings, household equipment and routine household maintenance at 1.7 percent this month from 1.9 percent in the past month; and Personal care and miscellaneous goods and services at 2.1 percent in the current month from 2.4 percent in the previous month.
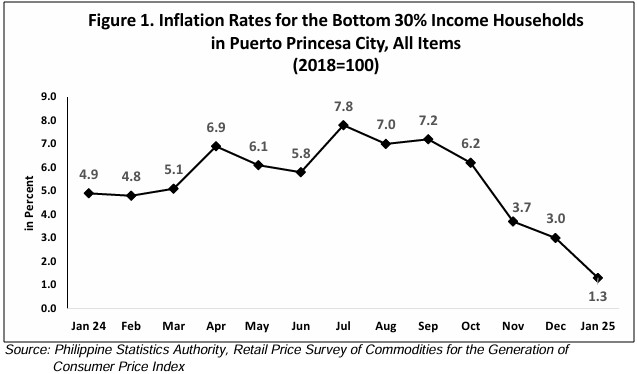
Table B. Year-on-Year Inflation Rates for the Bottom 30% Income Households
in Puerto Princesa City, All Items, In Percent
(2018 = 100)
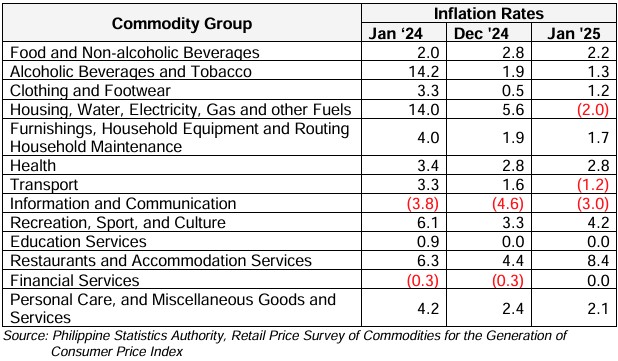
In contrast, higher annual growth rates were noted in the indices of the following commodity groups during the month:
a) Clothing and footwear, 1.3 percent from 0.5 percent;
b) Information and communication, -3.0 percent from -4.6 percent;
c) Recreation, sport and culture, 4.2 percent from 3.3 percent;
d) Restaurants and accommodation services, 8.4 percent from 4.4 percent; and
e) Financial services, 0.0 percent from -0.3 percent.
The indices of Health and Education services retained their respective previous month’s annual rates.
Table C. Year-on-Year Inflation Rates for the Bottom 30% Income Households
in Puerto Princesa City, By Food Group, In Percent
(2018 = 100)
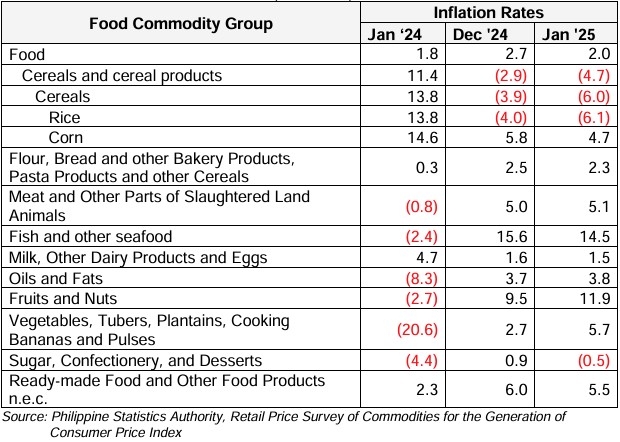
Food inflation for the bottom 30% income households in Puerto Princesa City registered an annual decline of 2.0 percent in January 2025 from 2.7 percent in the previous month. In January 2024, its annual increase was observed at 1.8 percent. (Table C)
The deceleration of food inflation in Puerto Princesa City was mainly due to the faster annual decline in the Rice index at 6.1 percent during the month from a 4.0 percent annual decline in December 2024.
Lower inflation rates were also noted in the following food groups:
a. Corn, 4.7 percent from 5.8 percent;
b. Flour, bread and other bakery products, pasta products and other cereals, 2.3 percent from 2.5 percent;
c. Fish and other seafood, 14.5 percent from 15.6 percent;
d. Milk, other dairy products and eggs, 1.5 percent from 1.6 percent;
e. Sugar, confectionery and desserts, -0.5 percent from 0.9 percent; and
f. Ready-made food and other food products n.e.c., 5.5 percent from 6.0 percent.
On the other hand, higher annual increases were noted in the following food groups:
a. Meat and other parts of slaughtered land animals, 5.1 percent from 5.0 percent;
b. Oils and fats, 3.8 percent from 3.7 percent;
c. Fruits and nuts, 11.9 percent from 9.5 percent; and
d. Vegetables, tubers, plantains, cooking bananas and pulses, 5.7 percent from 2.7 percent.
Table D. Year-on-Year Inflation Rates for the Bottom 30% Income Households
in Puerto Princesa City, All Items, In Percent
January 2022 – January 2025
(2018 = 100)
DONNA MARIE D. MOBE
Supervising Statistical Specialist
Officer-In-Charge
Palawan Provincial Statistical Office