

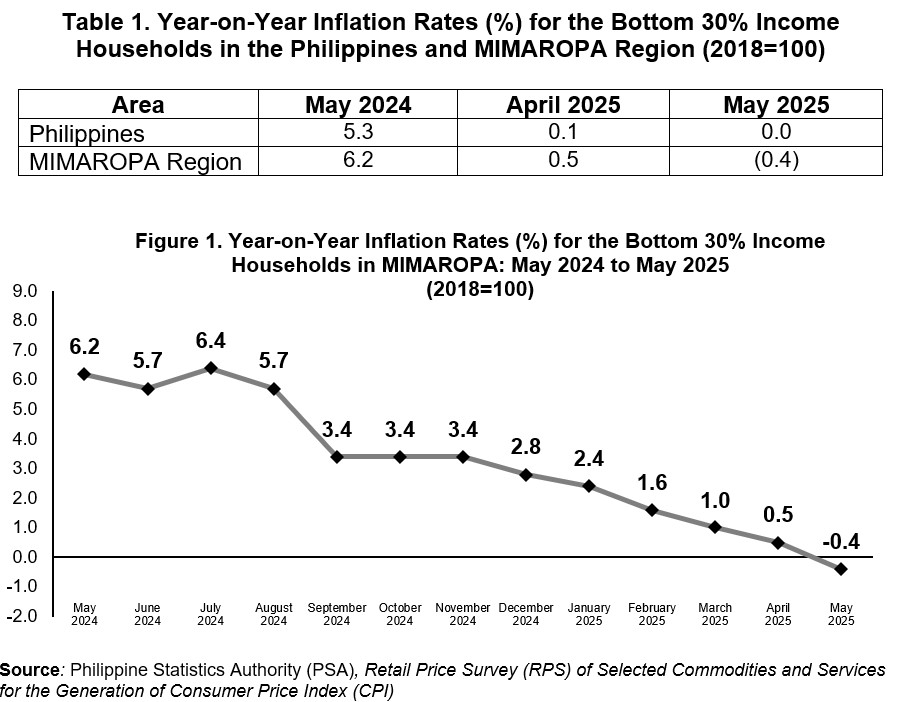
The inflation rate at the regional level, for the bottom 30% income households, declined to -0.4 percent in May 2025, or a 0.9 percentage point decrease from the April 2025 inflation. The index was recorded at 6.2 percent in the same reference month of the previous year. The main contributors to the downtrend of inflation were food and non-alcoholic beverages (-2.2% inflation), and housing, water, electricity, gas, and other fuels (0.7% inflation).
INFLATION RATE BY COMMODITY GROUP
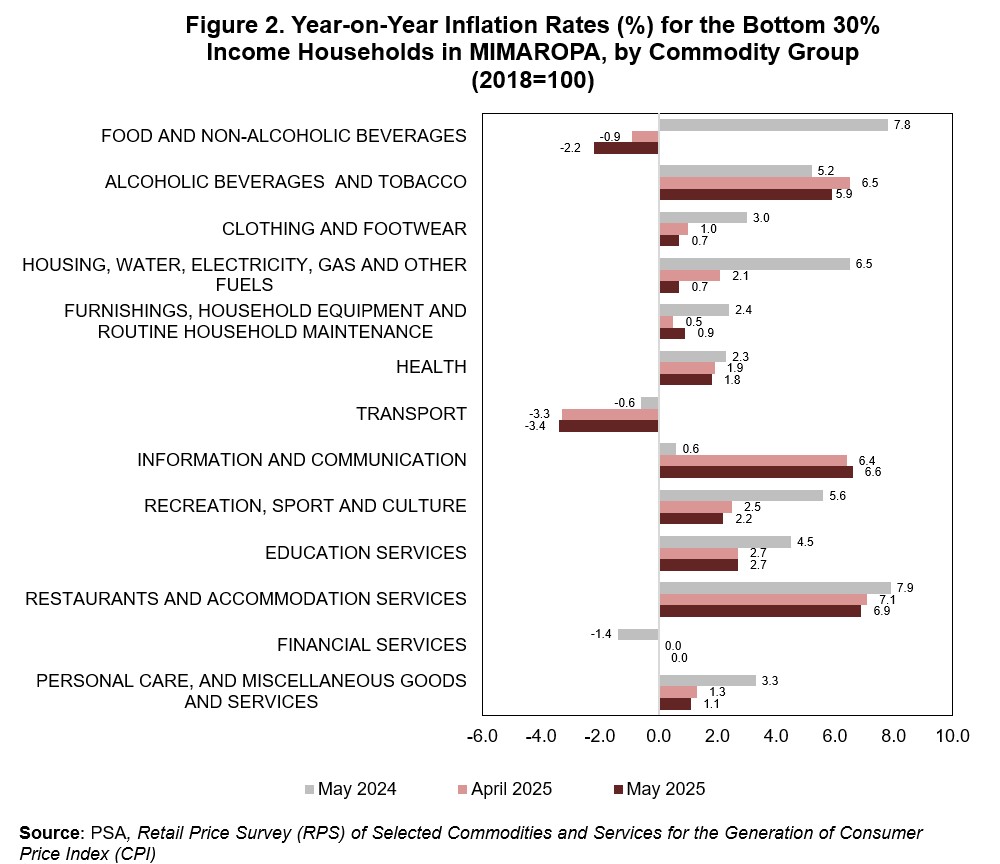
Moreover, the following commodity groups exhibited a lower annual gain in May 2025:
• Restaurants and accommodation services (6.9% inflation),
• Alcoholic beverages and tobacco (5.9% inflation),
• Recreation, sport, and culture (2.2% inflation),
• Health (1.8% inflation),
• Personal care, and miscellaneous goods and services (1.1% inflation), and
• Clothing and footwear (0.7% inflation).
In addition, a slightly faster decline was noted for transport, at 3.4 percent in May 2025, from a 3.3 percent drop in April 2025.
On the other hand, commodity groups of information and communication (6.6% inflation) and furnishings, household equipment, and routine household maintenance (0.9% inflation) recorded a higher annual increment in May 2025, compared with the indices in the previous month.
Meanwhile, the commodity groups of education services (2.7% inflation) and financial services (0.0% inflation) retained their previous month’s inflation rate.
INFLATION RATE BY FOOD GROUP
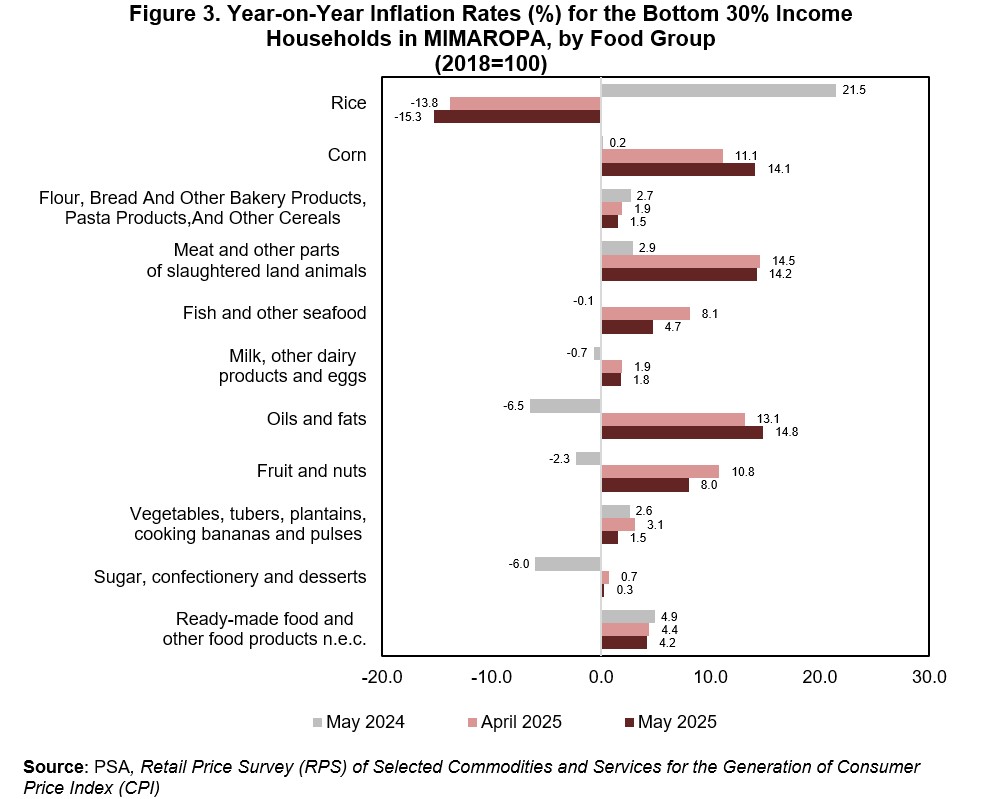
The region’s food index further decelerated to -2.7 percent in May 2025, from -1.3 percent in the previous month, and 8.1 percent in May 2024. Moreover, the downtrend in food inflation was mainly contributed by rice (-15.3% inflation), fish and other seafood (4.7% inflation), and vegetables, tubers, plantains, cooking bananas, and pulses (1.5% inflation).
Additionally, the following food groups posted lower annual indices in May 2025:
• Meat and other parts of slaughtered land animals (14.2% inflation),
• Fruits and nuts (8.0% inflation),
• Fish and other seafood (4.7% inflation),
• Ready-made food and other food products n.e.c. (4.2% inflation)
• Milk, other dairy products, and eggs (1.8% inflation), and
• Sugar, confectionery, and dessert (0.3% inflation)
In contrast, oil and fats (14.8% inflation) and corn (14.1% inflation) registered a faster growth in their May 2025 inflation rate.
INFLATION RATE BY PROVINCE
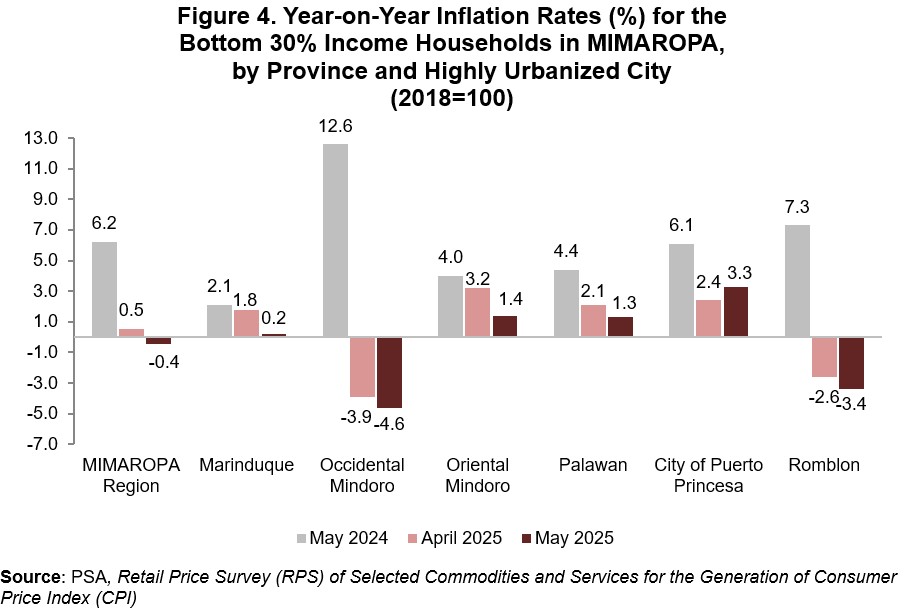
Among the provinces and highly urbanized city in the region, the city of Puerto Princesa had the highest inflation for the bottom 30 percent income households, with 3.3 percent, while Occidental Mindoro posted the lowest, with -4.6 percent.
Additionally, Oriental Mindoro (1.4% inflation), Palawan (1.3% inflation), and Marinduque (1.8% inflation) recorded a slower growth in May 2025, compared with their previous month’s inflation rate.
In contrast, only the city of Puerto Princesa (3.3% inflation) showed a faster increase in the prices of goods and services.
The provinces of Occidental Mindoro and Romblon registered a faster decline in their inflation rates in May 2025 at -4.6 percent and -3.4 percent, respectively.
(SGD) LENI R. RIOFLORIDO
Regional Director
MLLM / OHG / APAR / CNB