

City of Puerto Princesa
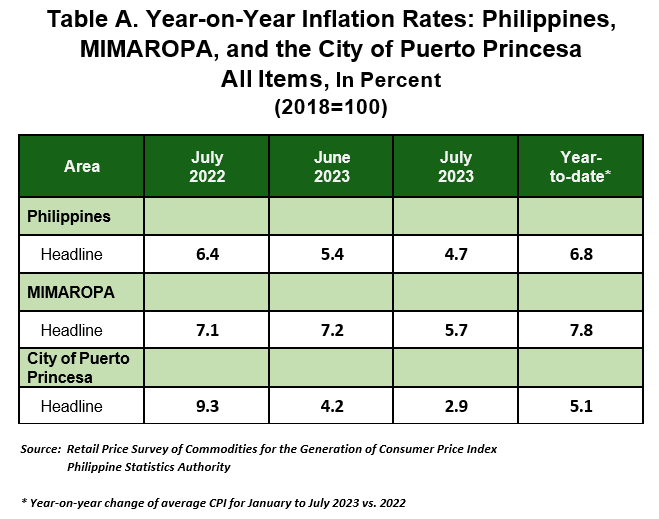
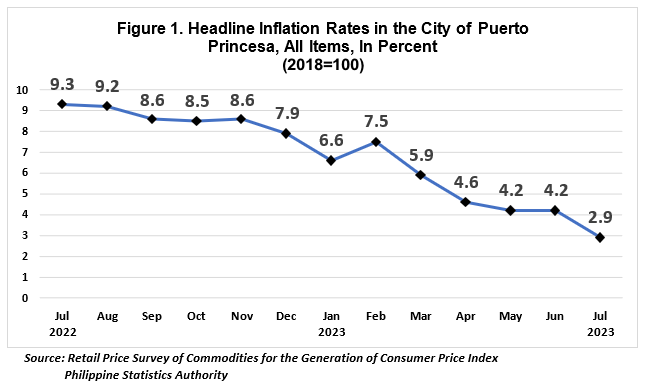
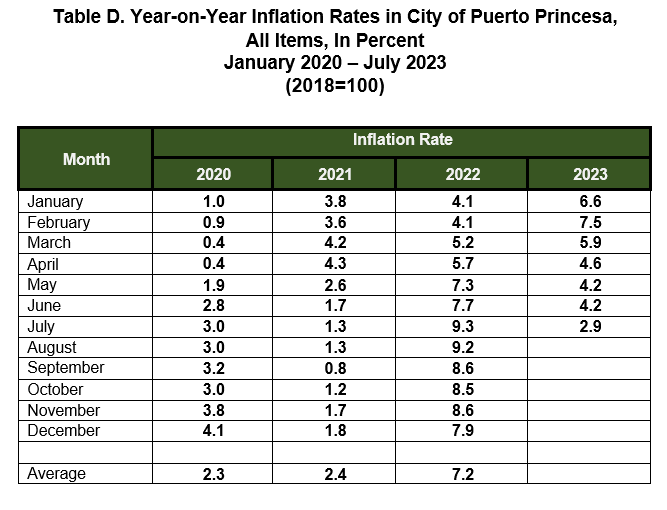
The headline inflation in the City of Puerto Princesa for July 2023 dipped to
2.9 percent from 4.2 percent in June 2023. In July 2022, the headline inflation was higher, at 9.3 percent. The average inflation rate for the first seven months of the year stood at 5.1 percent, (Table A and Figure 1).
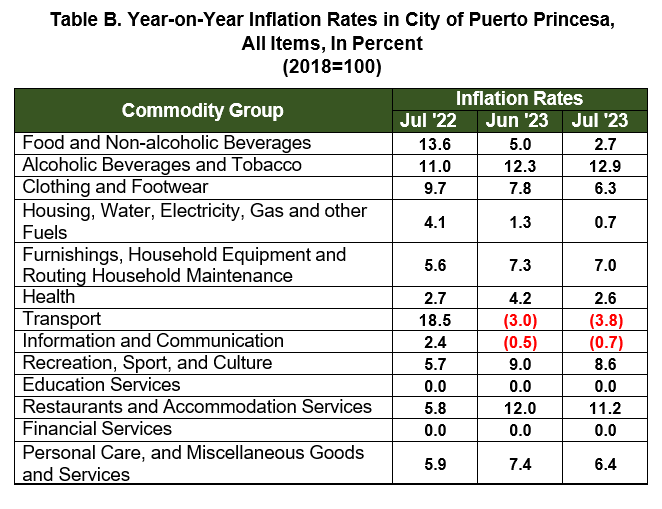
The downtrend for the overall inflation for the city is mainly attributed to the lower annual increment of the heavily-weighted Food and Non-Alcoholic Beverages at 2.7 percent, from 5.0 percent in the previous month. This was followed by, Housing, Water, Electricity, Gas and Other Fuels at 0.7 percent, from 1.3 percent in June 2023. The third driver to the slowdown was Transport which exhibited an annual decline of -3.8 percent, from -3.0 percent last month.
Furthermore, lower indices were also observed in the following commodities:
a. Clothing and Footwear, 6.3 percent;
b. Restaurants and Accommodation Services, 11.2 percent;
c. Personal Care, and Miscellaneous Good and Services, 6.4 percent;
d. Health, 2.6 percent;
e. Furnishings, Household Equipment and Routine Household Maintenance, 7.0 percent;
f. Information and Communication, -0.7 percent; and
g. Recreation, Sport and Culture, 8.6 percent.
On the other hand, faster annual increment was posted in the index of Alcoholic Beverages and Tobacco at 12.9 percent from 12.3 percent last month. The indices of Education Services and Financial Services retained their previous month’s inflation rates of 0.0 percent.
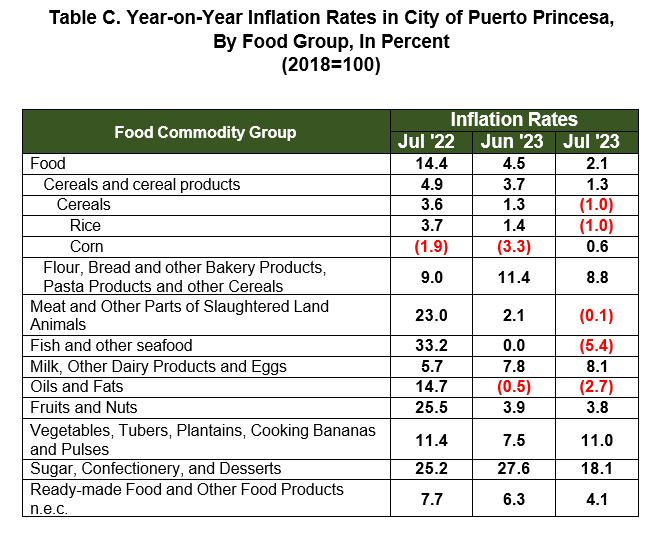
Food inflation in July 2023 decelerated to 2.1 percent from 4.5 percent in the previous month. In July 2022, the food index was higher at 14.4 percent inflation rate, (Table C).
The main drivers for the downtrend in food inflation were Fish and Other Seafood at -5.4 percent, from 0.0 percent in June 2023. This was followed by Rice at -1.0 percent from 1.4 percent last month. The third main driver is Meat and Other Parts of Slaughtered Land Animals at -0.1 percent from 2.1 percent in the previous month.
Furthermore, lower indices were also observed in the following commodities:
a. Sugar, Confectionery and Desserts, 18.1 percent;
b. Flour, Bread, And Other Bakery Products, Pasta Products and Other Cereals, 8.8 percent;
c. Ready-made Food and Other Food Products n.e.c., 4.1 percent;
d. Oils and Fats, -2.7 percent; and
e. Fruits and Nuts, 3.8 percent.
Meanwhile, the higher upticks were observed in the following commodities:
a. Vegetables, Tubers, Plantains, Cooking Bananas and Pulses, 11.0
percent;
b. Milk, Other Dairy Products and Eggs, 8.1 percent; and
c. Corn, 0.6 percent.

")
")
")