

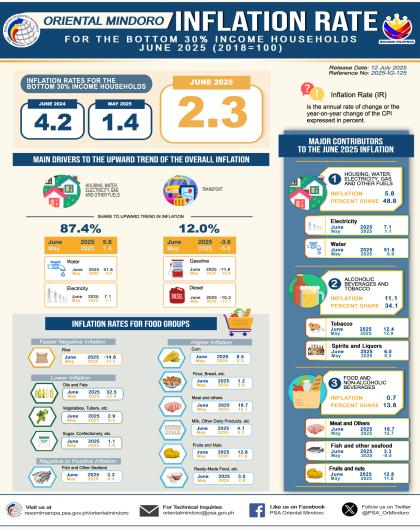
Overall Inflation
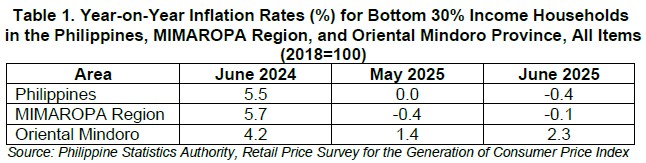
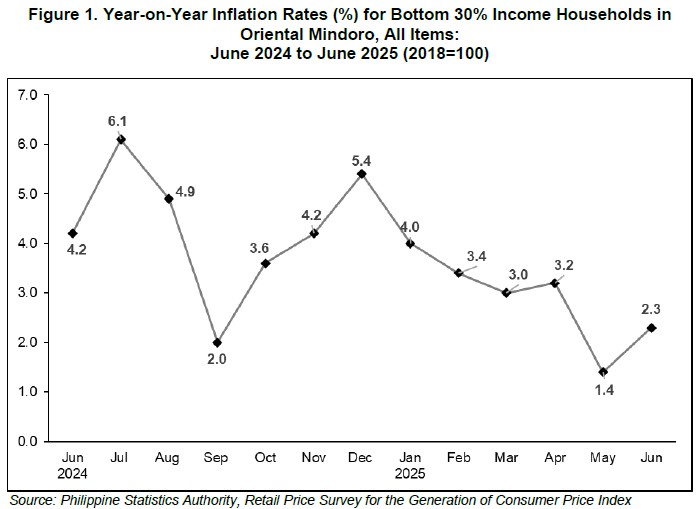
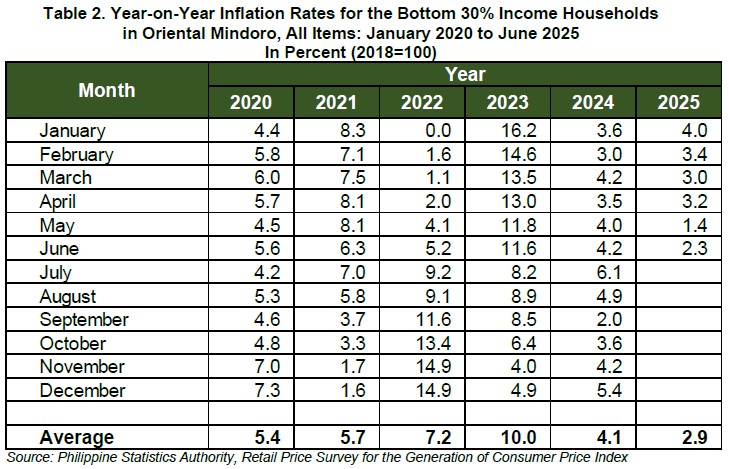
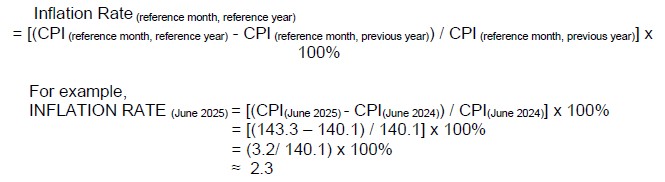
Oriental Mindoro’s inflation rate for the bottom 30% income households increased to 2.3 percent in June 2025 from 1.4 percent in May 2025. This brings the provincial average inflation rate for this income group from January to June 2025 to 2.9 percent. In June 2024, inflation rate was higher at 4.2 percent. (Tables 1, 2 and Figure 1)
Main Drivers to the Upward Trend of the Overall Inflation
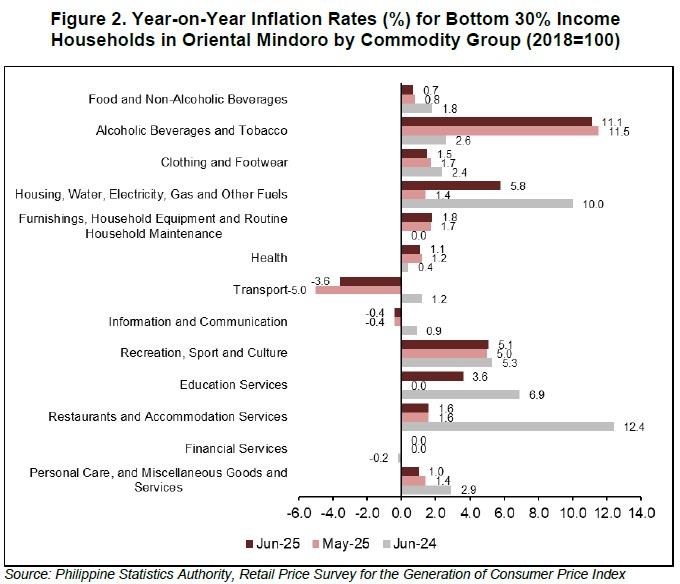
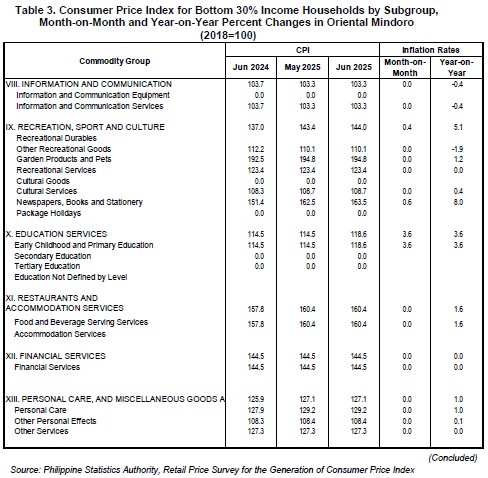
The uptrend in the overall inflation rate for the bottom 30% income households in June 2025 was primarily brought about by the faster annual increment in the index of housing, water, electricity, gas and other fuels at 5.8 percent in June 2025 from 1.4 percent in May 2025. Transport also contributed with a slower annual decrease of 3.6 percent from a 5.0 percent decrement in the previous month.
In addition, higher inflation rates during the month were noted in the indices of the following:
a. furnishings, household equipment and routine household maintenance at 1.8 percent from 1.7 percent;
b. recreation, sport and culture, 5.1 percent from 5.0 percent; and
c. education services, 3.6 percent from 0.0 percent.
In contrast, lower annual growth rates were recorded in the indices of the following commodity groups during the month:
a. food and non-alcoholic beverages, 0.7 percent from 0.8 percent;
b. alcoholic beverages and tobacco, 11.1 percent from 11.5 percent;
c. clothing and footwear, 1.5 percent from 1.7 percent;
d. health, 1.1 percent from 1.2 percent; and
e. personal care, and miscellaneous goods and services, 1.0 percent from 1.4 percent.
The indices of the rest of the commodity groups retained their respective previous month’s annual growth rates, with financial services registering zero percent annual rate in June 2025. (Figure 2)
Main Contributors to the June 2025 Overall Inflation
The following commodity groups were the top three contributors to the June 2025 overall inflation for the bottom 30% income households of the province:
a. Housing, water, electricity, gas and other fuels with 48.8 percentage share or 1.12 percentage points;
b. Alcoholic beverages and tobacco with 34.1 percentage share or 0.78 percentage points; and
c. Food and non-alcoholic beverages with 13.8 percentage share or 0.32 percentage points.
Food Inflation
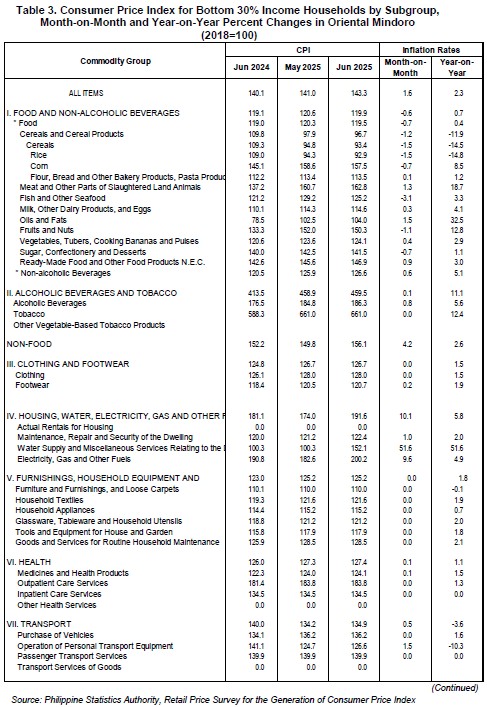
Food inflation for the bottom 30% income households in Oriental Mindoro moved at a slower pace of 0.4 percent in June 2025 from 0.5 percent in the previous month. In June 2024, food inflation was higher at 1.9 percent. (Table 3)
Main Drivers to the Downward Trend of Food Inflation
The deceleration of food inflation in June 2025 was primarily due to the faster annual decline in the index of rice at 14.8 percent from a 12.3 percent annual decrease in May 2025. Moreover, the slower annual increase in the index of vegetables, tubers, plantains, cooking bananas and pulses at 2.9 percent in June 2025 from a 9.3 percent increment in the previous month also contributed to downtrend of the food inflation.
In addition, lower inflation rates during the month were noted in oils and fats at 32.5 percent from 32.8 percent in May 2025, and sugar, confectionery and desserts at 1.1 percent from 1.9 percent in May 2025.
INFLATION RATE BY FOOD GROUP
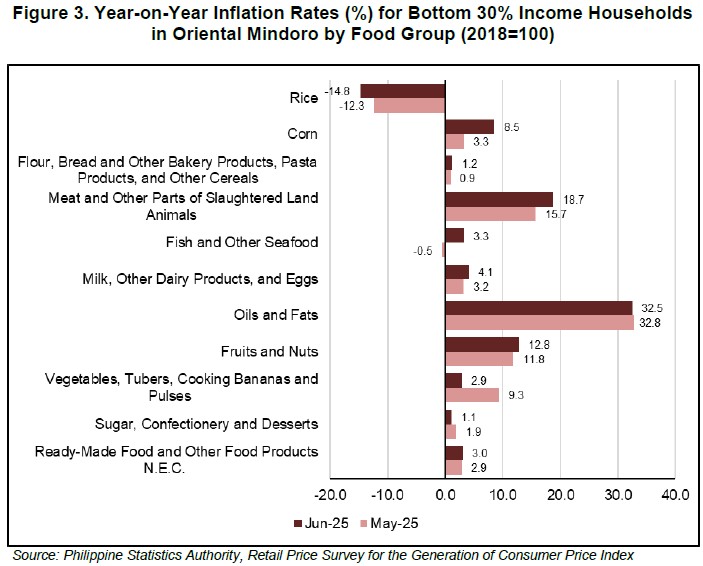
In contrast, higher annual increases were noted in the following food groups:
a. Corn, 8.5 percent from 3.3 percent;
b. Flour, bread and other bakery products, pasta products, and other cereals, 1.2 percent from 0.9 percent;
c. Meat and other parts of slaughtered land animals, 18.7 percent from 15.7 percent;
d. Milk, other dairy products and eggs, 4.1 percent from 3.2 percent;
e. Fruits and nuts, 12.8 percent from 11.8 percent; and
f. Ready-made food and other food products n.e.c., 3.0 percent from 2.9 percent. (Figure 3 and Table 3)
Main Contributors to Food Inflation
Food inflation contributed 8.5 percent or 0.19 percentage point to the June 2025 overall inflation of the bottom 30% income households.
Among the food groups, the main contributors to the food inflation during the month were the following:
a. meat and other parts of slaughtered land animal with 799.8 percent share or 3.20 percentage points;
b. fish and other seafood with 147.8 percent share or 0.59 percentage point; and
c. fruits and nuts with 140.2 percent share or 0.56 percentage point.
(SGD) CHARLYN ROMERO-CANTOS, PhD
(Chief Administrative Officer)
Officer-in-Charge
Oriental Mindoro Provincial Statistical Office
HTD/JGO
TECHNICAL NOTES
Consumer Price Index is an indicator of the change in the average prices of a fixed basket of goods and services commonly purchased by households relative to a base year.
Market Basket is a sample of goods and services, which is meant to represent the totality of all the goods and services purchased by households relative to a base year.
To determine the commodities that will form the market basket for the 2018-based CPI, the Survey of Key Informants (SKI) was conducted in March 2021. The survey, which was conducted nationwide to store managers, sellers or proprietors, obtained information on the most commonly purchased of goods and availed of services by the households.
Base year is a reference period, usually a year, at which the index number is set to 100. It is the reference point of the index number series. The CPI is rebased from base year 2012 to base year 2018.
Inflation Rate is the annual rate of change or the year-on-year change in the Consumer Price Index (CPI).
- Purchasing Power of Peso is a measure of the real value of the peso in a given period relative to chosen reference period. It is computed by getting the reciprocal of the CPI and multiplying the result by 100
")
")
")