

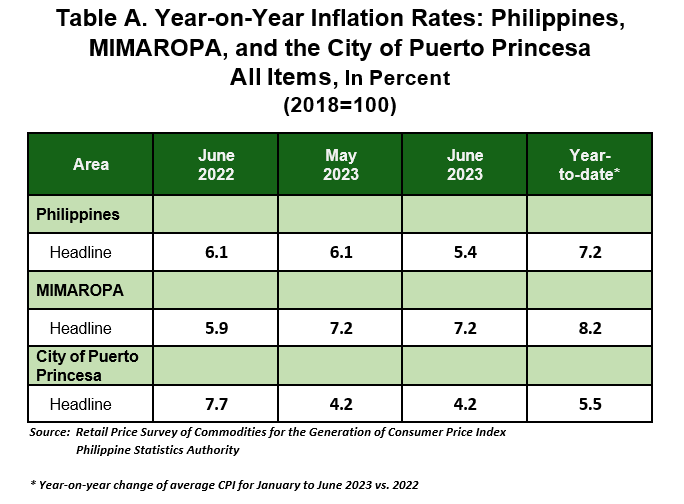
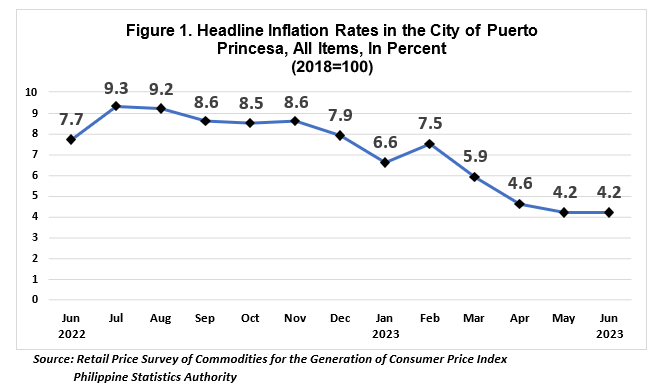
City of Puerto Princesa
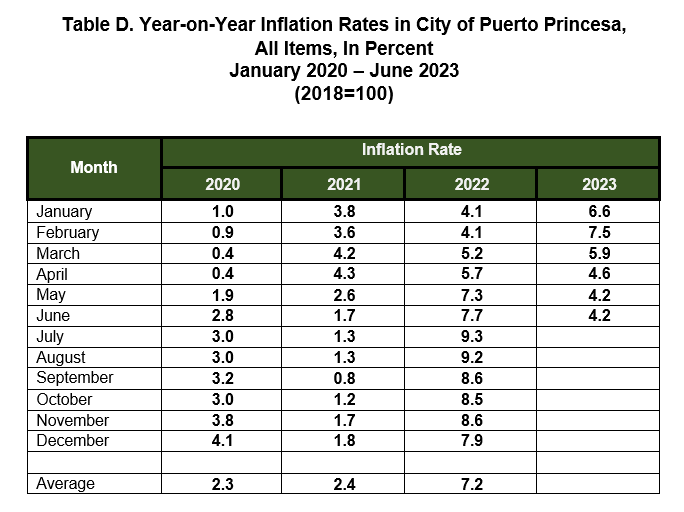
The headline inflation inthe City of Puerto Princesa remained at 4.2 percent for June 2023 as it posted the same annual growth rate in May 2023. In June 2022, the headline inflation was higher, at 7.7 percent. The average inflation rate for the first semester of the year stood at 5.5 percent, (Table A and Figure 1).
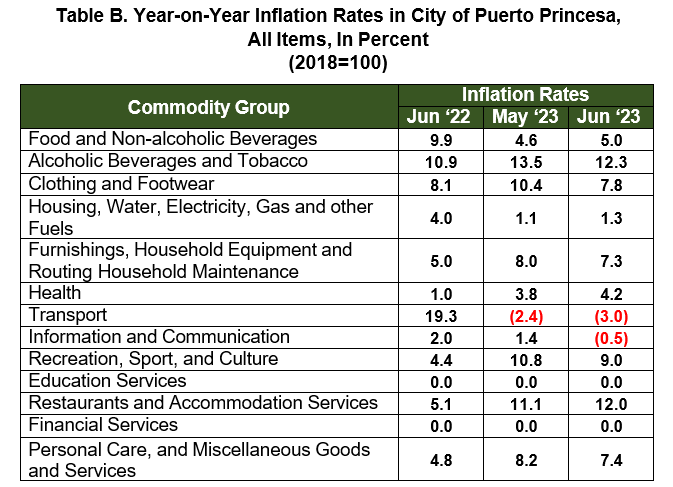
In June 2023, higher annual increments have been observed in the following commodities:
- Food and Non-Alcoholic Beverages, 5.0 percent;
- Housing, Water, Electricity, Gas and Other Fuels, 1.3 percent;
- Restaurants and Accommodation Services, 12.0 percent; and
- Health, 4.2 percent.
On the contrary, slowdowns were observed in the following commodities:
- Transport, -3.0 percent;
- Clothing and Footwear, 7.8 percent;
- Personal Care, and Miscellaneous Good and Services, 7.4 percent;
- Information and Communication, -0.5 percent;
- Furnishings, Household Equipment and Routine Household Maintenance, 7.3 percent;
- Alcoholic Beverages and Tobacco, 12.3 percent; and
- Recreation, Sport ,and Culture, 9.0 percent.
Meanwhile, Education and Financial Services retained their previous month’s inflation rates at 0.0 percent.
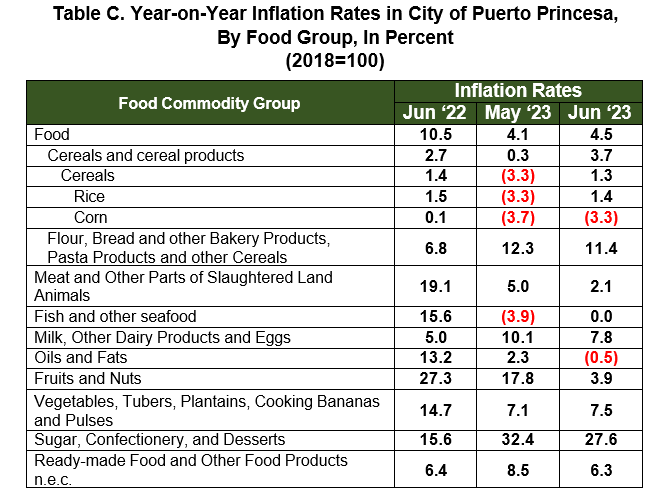
Food inflation in June 2023 accelerated to 4.5 percent from 4.1 percent in the previous month. In June 2022, the food index was higher at 10.5 percent inflation rate, (Table C).
The main driver for the increasein food inflation was Rice at 1.4 percent, from
-3.3 percent in May 2023. This was followed by Fish and Other Seafood at
0.0 percent from -3.9 percent; Vegetables, Tubers, Plantains, Cooking Bananas and Pulses at 7.5 percent from 7.1 percent; and lastly Corn at -3.3 percent from -3.7 percent last month.
Meanwhile, lower indices were observed in the following commodities:
Meat and Other Parts of Slaughtered Land Animals, 2.1 percent;
Flour, Bread, And Other Bakery Products, Pasta Products and Other Cereals, 11.4 percent;
Milk, Other Dairy Products and Eggs, 7.8 percent;
Fruits and Nuts, 3.9 percent;
Ready-made Food and Other Food Products n.e.c.,6.3 percent;
Sugar, Confectionery and Desserts, 27.6 percent; and
Oils and Fats, -0.5 percent.

")
")
")