

Table A. Year-on-Year Inflation Rates: Philippines, MIMAROPA, and Palawan
All Items, In Percent (2018=100)
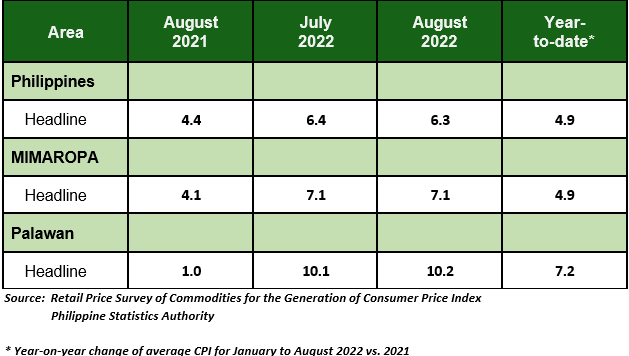
Palawan
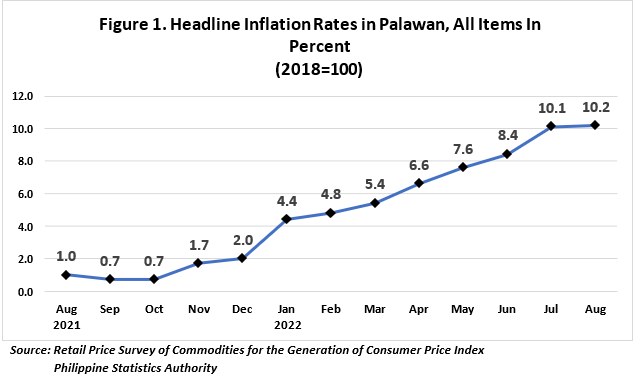
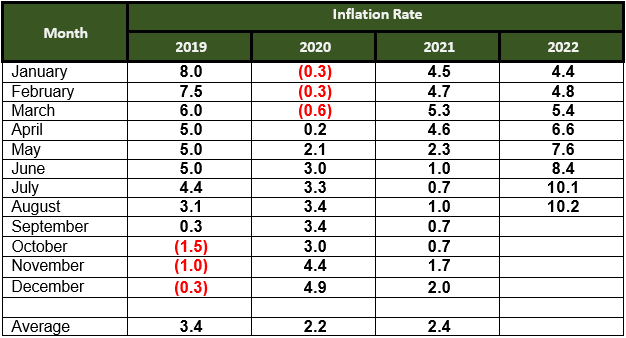
The headline inflation in Palawan increased further to 10.2 percent in August 2022, from 10.1 percent in July 2022. This is the highest recorded inflation since January 2019. Inflation in July 2021 was significantly lower at
1.0 percent. The average inflation for the first eight months of the year stood at 7.2 percent, (Table A and Figure 1).
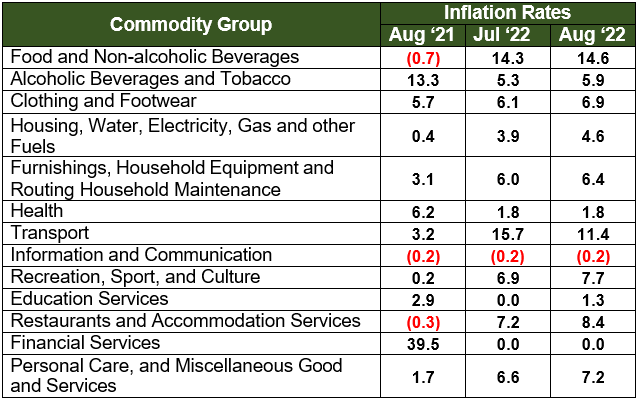
The growth in the provincial inflation can be mainly attributed to the higher annual increments in the index for Food and non-alcoholic beverages at 14.6 percent; Housing, water, electricity, gas and other fuels, at 4.6 percent; and Restaurants and accommodation services, at 8.4 percent. Furthermore, higher indices of the following commodity groups during the period also factored into the uptrend in the overall inflation rate of the province:
a. Clothing and footwear, 6.9 percent;
b. Personal Care, and Miscellaneous Good and Services, 7.2 percent;
c. Alcoholic Beverages and Tobacco, 5.9 percent;
d. Furnishings, Household Equipment and Routing Household Maintenance, 6.4 percent;
e. Recreation, Sport, and Culture, 7.7 percent; and
f. Education Services, 1.3 percent.
Meanwhile, Transport registered a slowdown of 11.4 percent. While the rest of the commodity groups showed no month-on-month change in inflation.
Table B. Year-on-Year Inflation Rates in Palawan, All Items In Percent
(2018=100)
The food index increased further to 15.2 percent in August 2022, from 15.0 percent in the previous month. In July 2021, food index was lower, at -1.1 percent. (Table C)
During this period, major contributors to the uptrend in the food index were higher increments for Rice, 10.9 percent; Sugar, confectionery, and desserts, at 51.3 percent and Flour, bread and other bakery products, pasta products and other cereals, 11.0 percent. Additionally, higher growth rates were observed in the following food indices:
a. Milk, other dairy products and eggs, 6.4 percent;
b. Meat and other parts of slaughtered land animals, 19.9 percent;
c. Ready-made food and other food products n.e.c., 12.9 percent; and
d. Oils and fats, 16.9 percent.
Meanwhile, the following food commodity groups which exhibited a slowdown in inflation are:
a. Fruits and Nuts, 24.6 percent;
b. Vegetables, tubers, plantains, cooking bananas and pulses, 15.6 percent;
c. Fish and other seafood, 15.4 percent; and
d. Corn, at 1.9 percent.
Table C. Year-on-Year Inflation Rates in Palawan, By Food Group
In Percent (2018=100)
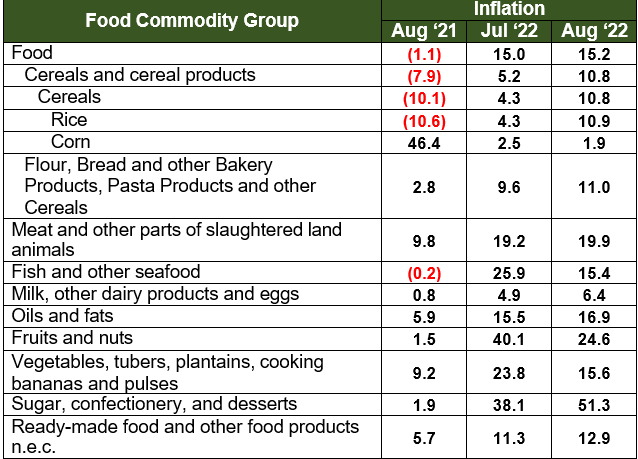
Table D. Year-on-Year Inflation Rates in Palawan, All Items In Percent
January 2019 – August 2022
(2018=100)

")
")
")
 June 2024")