

Palawan
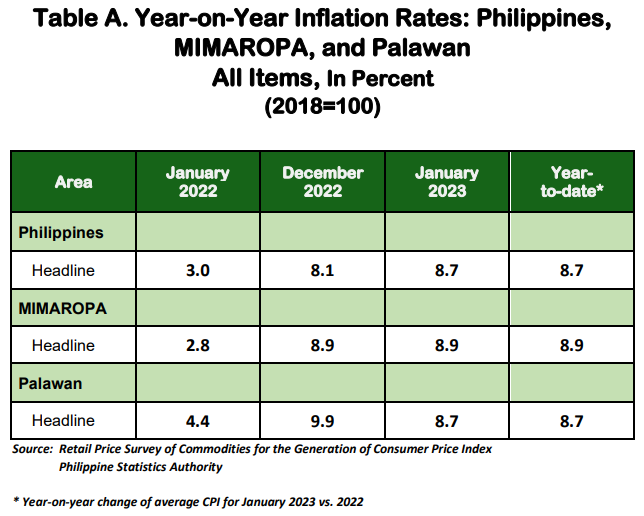
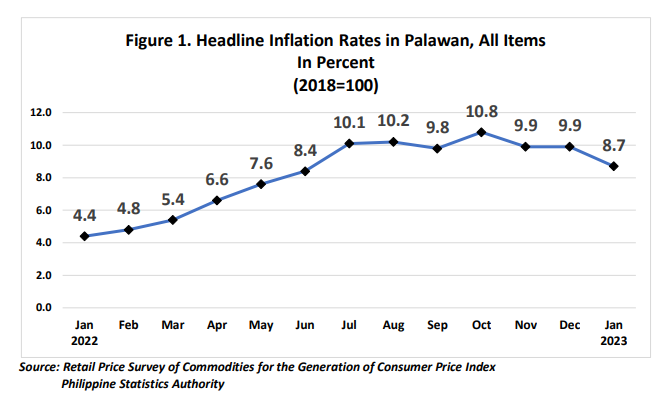
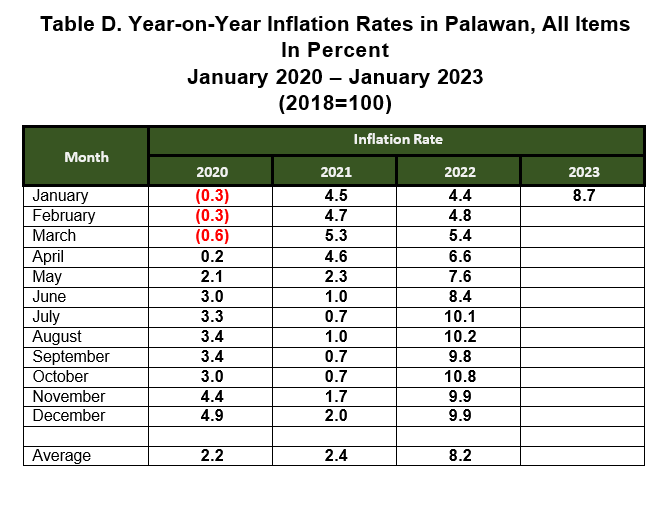
Headline inflation for the province of Palawan declined to 8.7 percent for January 2023, from 9.9 percent in December 2022. Meanwhile, inflation in January 2022 registered at 4.4 percent. (Table A and Figure 1)
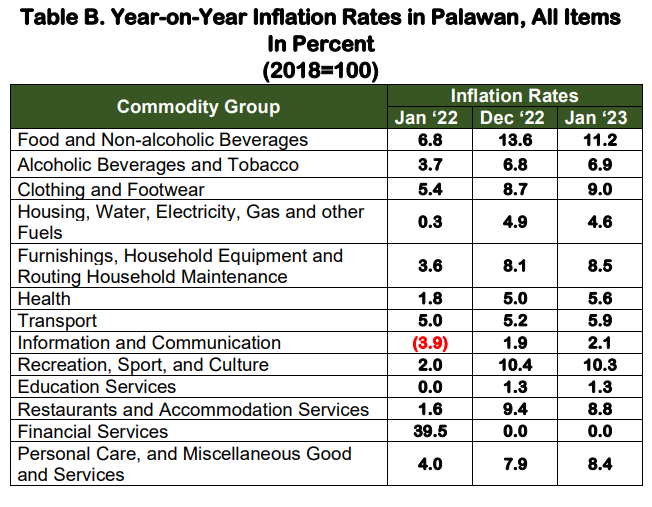
The downtrend in the provincial inflation can be mainly attributed to the lower indices registered in Food and Non-Alcoholic Beverages, at 11.2 percent. Followed by Housing, Water, Electricity, Gas and Other Fuels, at 4.6 percent; Restaurants and Accommodation Services, at 8.8 percent; and Recreation, Sport and Culture at 10.3 percent.
On the other hand, higher annual indices of the following commodities were registered in January 2023:
a. Transport, 5.9 percent;
b. Clothing and Footwear, 9.0 percent;
c. Personal Care, and Miscellaneous Good and Services, 8.4 percent;
d. Furnishings, Household Equipment and Routine Household Maintenance, 8.5 percent;
e. Alcoholic Beverages and Tobacco, 6.9 percent;
f. Health, 5.6 percent;
g. Information and Communication, 2.1 percent;
Meanwhile, the rest of the commodity groups maintained their previous month’s inflation rates.
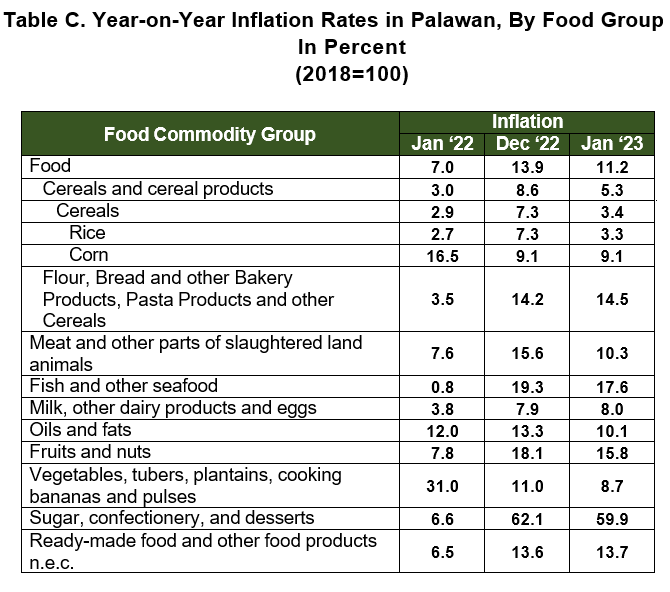
Food index in January 2023 decelerated to 11.2 percent, from 13.9 percent in the previous month. In January 2022, the food index was lower, at 7.0 percent. (Table C)
During this period, major contributors to the downtrend in the food index were Rice, at 3.3 percent, followed by Meat and Other Parts of Slaughtered Land Animals, at 10.3 percent, and Fish and other Seafood 17.6 percent. Furthermore, other commodities that registered lower indices are the following:
a. Vegetables, tubers, plantains, cooking bananas and pulses, 8.7
percent;
b. Fruits and Nuts, 15.8 percent;
c. Sugar, confectionery and desserts, 59.9 percent; and
d. Oils and Fats, 10.1 percent;
On the other hand, other commodities that posted higher indices are the following:
a. Flour, Bread and other Bakery Products, Pasta Products and other Cereals, 14.5 percent;
b. Ready-made food and other food products n.e.c., 13.7 percent; and
c. Milk, other dairy products and eggs, 8.0 percent.
Meanwhile, Corn retained its’ previous months inflation at 9.1 percent.

")
")
")