

Release Date :
Reference Number :
2022-08
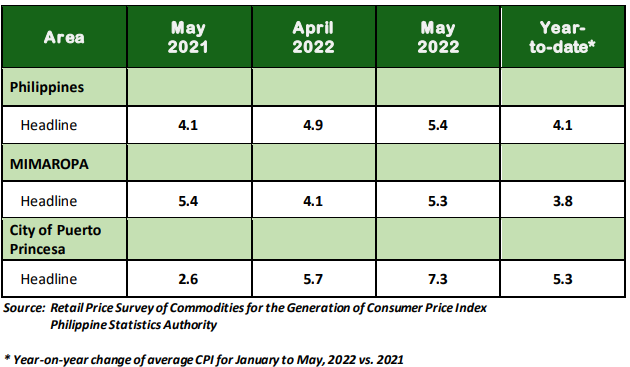
Table A. Year-on-Year Inflation Rates: Philippines, MIMAROPA, and the City of Puerto Princesa
All Items, In Percent (2018=100)
City of Puerto Princesa
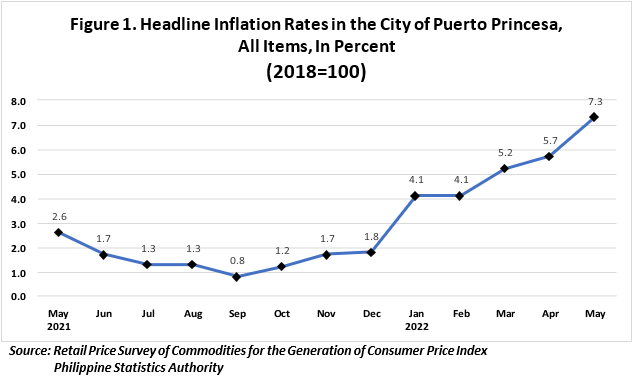
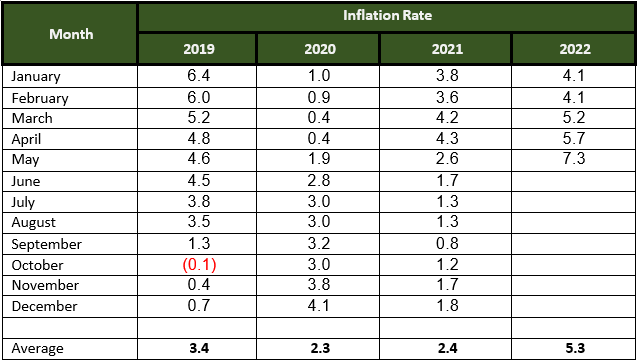
The headline inflation in City of Puerto Princesa escalated to 7.3 percent in May 2022, from 5.7 percent in April 2022 and 2.6 percent in April 2021. This is the highest recorded inflation since January 2019. The average inflation for the first five months of the year stood at 5.3 percent. (Table A)
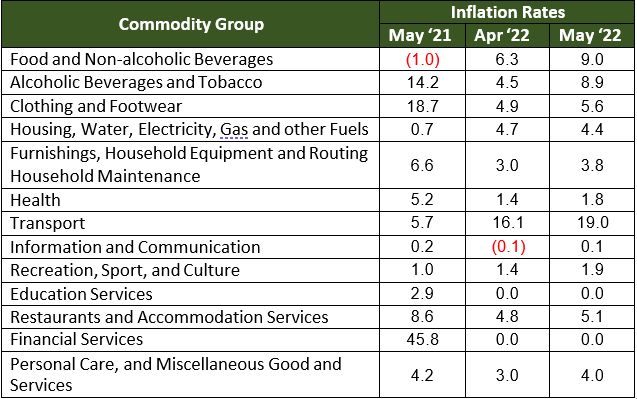
The increase in the city’s inflation was mainly brought by the higher annual increase in the index for food and non-alcoholic beverages at 9.0 percent; transport, 19.0 percent; and alcoholic beverages and tobacco, 8.9 percent. Furthermore, higher indices of the following commodity groups during the period also factored into the uptrend in the overall inflation rate of the province:
a. Personal care, and miscellaneous goods and services, 4.0 percent;
b. Clothing and footwear, 5.6 percent;
c. Furnishings, household equipment, and routine household maintenance, 3.8 percent.
d. Restaurants and accommodation services, 5.1 percent;
e. Health, 1.8 percent;
f. Information and communication, 0.1 percent; and
g. Recreation, sport, and culture, 1.9 percent.
On the other hand, the index for Housing, water, electricity, gas, and other fuels declined to 4.4 percent. While the rest of the commodity groups either retained their previous month’s inflation rates or had zero percent annual growth.
Table B. Year-on-Year Inflation Rates in City of Puerto Princesa,
All Items, In Percent (2018=100)
Food index increased further by 9.5 percent in May 2022, from 6.5 percent in the previous month. In May 2021, the food index was lower by -1.3 percent. (Table C)
During this period, major contributors to the uptrend in the food index were higher increments for Fish and other seafood, 17.6 percent; Vegetables, tubers, plantains, cooking bananas, and pulses, 15.7 percent and Meat and other parts of slaughtered land animals at 15.5 percent. Additionally, higher growth rates were observed in the following food indices:
a. Sugar, confectionery, and desserts, 11.3 percent;
b. Ready-made food and other food products n.e.c.,, 5.5 percent;
c. Oils and fats, 12.4 percent;
d. Flour, Bread and other Bakery Products, Pasta Products and other Cereals, 5.8 percent; and
e. Milk, other dairy products, and eggs, 2.8 percent.
On the other hand, the corn index remained at 0.8 percent inflation. Only the rice index registered a slowdown at 4.7 percent.
Table C. Year-on-Year Inflation Rates in City of Puerto Princesa,
By Food Group, In Percent (2018=100)
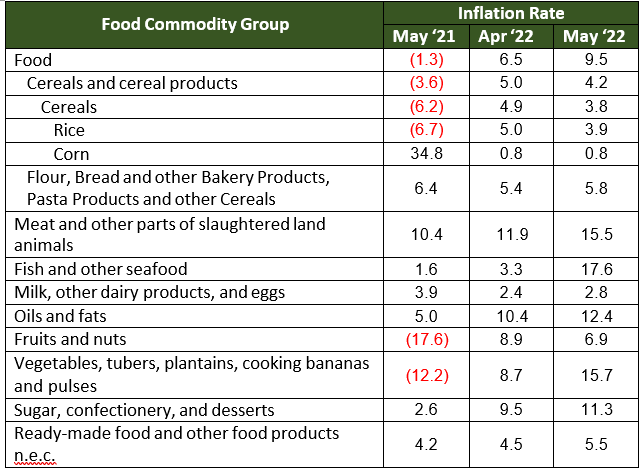
Table D. Year-on-Year Inflation Rates in City of Puerto Princesa, All Items, In Percent
January 2019 – April 2022
(2018=100)

| Attachment | Size |
|---|---|
|
|
1.09 MB |