

Release Date :
Reference Number :
SR - 2025 - 076
More than half of the total construction is non-residential
In February 2025, there were 107 constructions based on the approved building permits in the province of Romblon. This represents a 55.1 percent increase over the 69 total number of constructions in February 2024. (Figure 1)
By type of construction, non-residential buildings had the most constructions, at 55 or 51.4 percent of total constructions for the month. It showed a 189.5 percent increase over the same month of 2024 with a total of 19 constructions. Most of the non-residential constructions were commercial buildings with 47 constructions (85.5%). (Figures 1 and 2)
Then, residential type of constructions was the second highest in terms of number of constructions, accounting for 50 or 46.7 percent of total construction in February 2025. This recorded an annual decrease of 30.8 percent from the same month of the previous year’s level of 52 constructions. The majority residential constructions were single-type houses, with a total of 49 (98%). (Figures 1 and 2)
Figure 1. Number of Constructions from Approved Building Permits by Type, Romblon: February 2025p
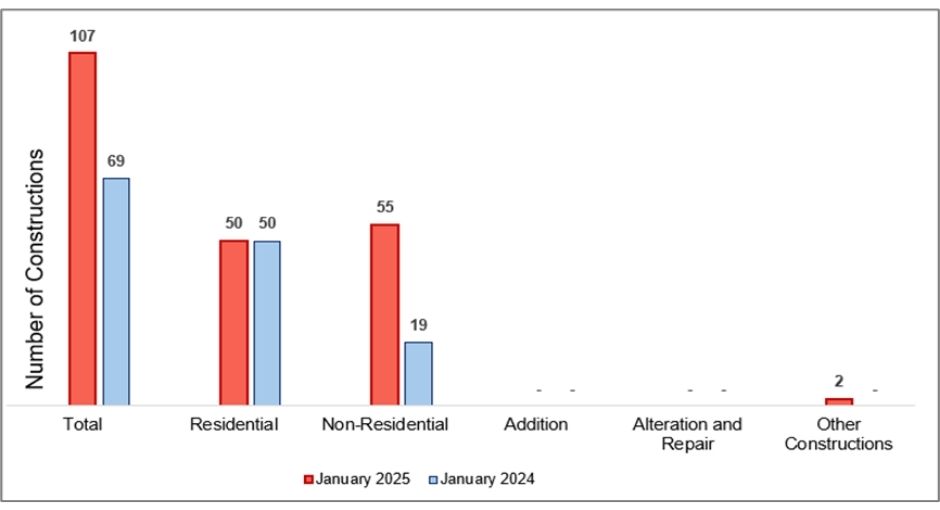
Source: Philippine Statistics Authority, February 2025 Construction Statistics from Approved Building Permits p
Figure 2. Number of Constructions from Approved Building Permits for
Residential and Non-residential, Romblon: February 2025p
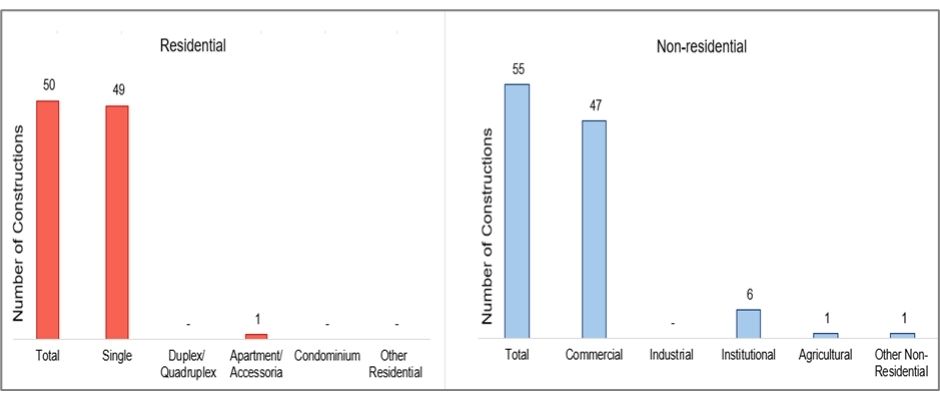
Source: Philippine Statistics Authority, February 2025 Construction Statistics from Approved Building Permits p
Other constructions made up to a total of 2 or 1.9 percent of all constructions in the period. Meanwhile, there is no recorded construction under addition, alteration and repair of existing structures. (Figure 1)
Non-residential buildings had the largest floor area of construction
In February 2025, the total floor area of all constructions in Romblon was 9,117 square meters. This excludes alteration and repair, other non-residential such as facade, helipad, niche, water tank, etc., and other constructions, which include demolition, street furniture, landscaping, and signboards, since there is no reported floor area for these types of constructions. The overall floor area in February 2025 had a 60 percent annual increase from the 5,698 square meters that had been recorded during the same period the previous year. (Figure 3)
Figure 3. Floor Area of Constructions from Approved Building Permits by Type,
Romblon: February 2025p
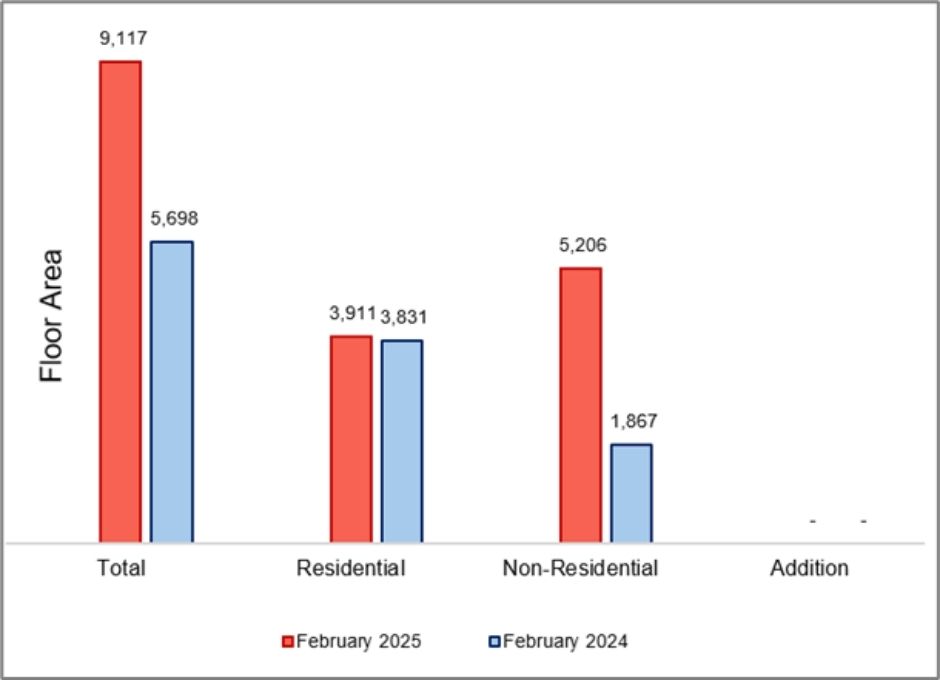
Source: Philippine Statistics Authority, February 2025 Construction Statistics from Approved Building Permits p
During the month, non-residential buildings represented 5,206 square meters, or 57.1 percent of all construction floor area. This represents an annual increase of 178.8 percent over the 1,867 square meters of non-residential building floor area recorded in the same month of 2024. Under non-residential constructions, commercial building recorded the highest number of floor area with 3,218 square meters (61.8%).
Meanwhile, residential constructions recorded 3,911 square meters or 42.9 percent of the total floor area of constructions in February 2025. It increased at an annual rate of 2.1 percent from the previous year’s same month floor area of 3,831 square meters. Single-type houses contributed the most with a total floor area of 3,827 square meters (97.9%). (Figures 3 and 4)
Figure 4. Floor Area of Constructions from Approved Building Permits for
Residential and Non-residential, Romblon: February 2025p
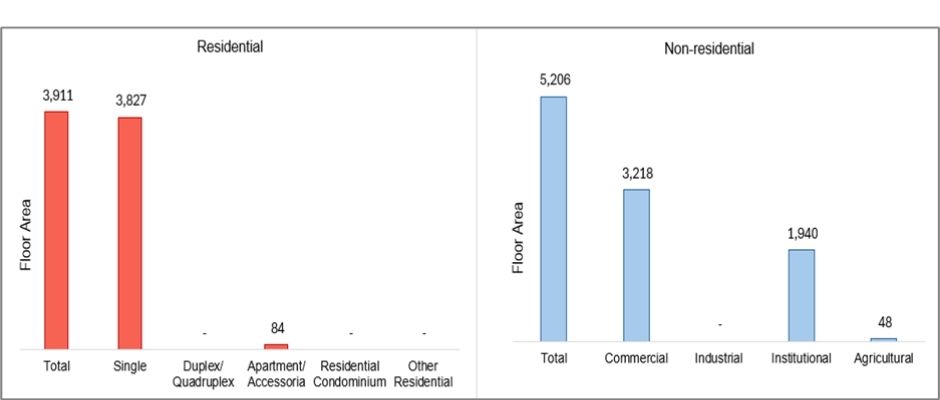
Source: Philippine Statistics Authority, February 2025 Construction Statistics from Approved Building Permits p
Non-residential buildings recorded the highest value of constructions
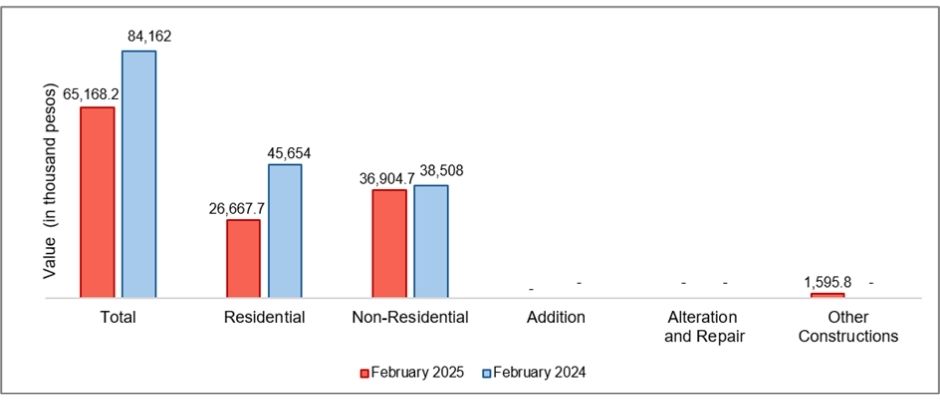
The total value of construction in February 2025 in the province of Romblon amounted to PhP 65.2 million, which is a 22.6 percent annual decrease over the PhP 84.2 million value of constructions posted in the same month of 2024. (Figure 5)
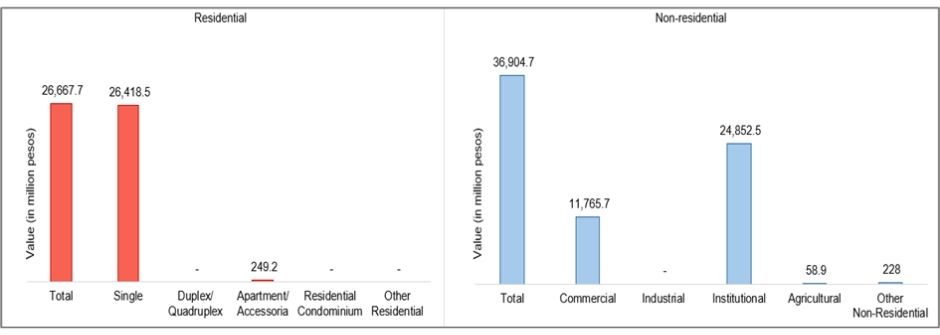
In February 2025, the construction value of non-residential buildings was PhP 36.9 million, or 50.9 percent of the total construction value. Compared to the PhP 38.5 million worth of non-residential building constructions reported in the same mont of 2024, this is a 4.2 percent annual decrease. At PhP 24.9 million (67.3%), institutional type buildings had the highest construction value among non-residential buildings.
With a total of PhP 26.7 million, residential building constructions made up 40.9 percent of all constructions during that period. In the same month of 2024, the construction value of residential buildings was PhP 45.7 million, indicating an annual decrease of 41.6 percent. The biggest value of residential structures, at PhP 26.4 million (99.1%), was found in single-type houses. (Figures 5 and 6)
Figure 5. Value of Constructions from Approved Building Permits by Type,
Romblon: February 2025p
Source: Philippine Statistics Authority, February 2025 Construction Statistics from Approved Building Permits p
Figure 6. Value of Constructions from Approved Building Permits for
Residential and Non-residential, Romblon: February 2025p
Source: Philippine Statistics Authority, February 2025 Construction Statistics from Approved Building Permits p
(SGD) ENGR. JOHNNY F. SOLIS
Chief Statistical Specialist
Romblon Provincial Statistical Office
| Attachment | Size |
|---|---|
|
|
194.45 KB |
|
|
53.51 KB |