MIMAROPA contributes 11.0 percent to the country’s total fish production
The total volume of fish production in the MIMAROPA Region in 2024 was estimated at 447,361.86 metric tons. This translated to a share of 11.0 percent in the overall fish production of the country. (Table A)
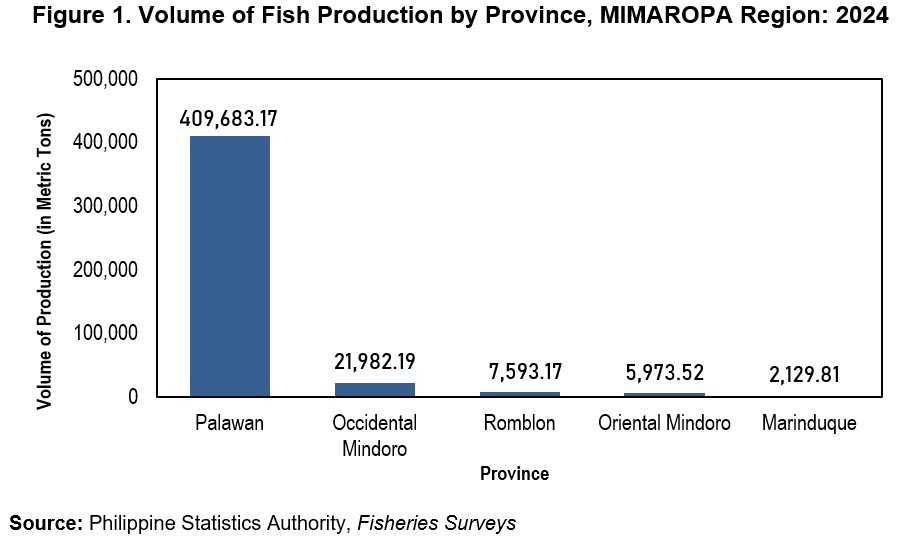
Among all provinces in the region, Palawan got the largest share of 91.6 percent of the regional fish production in 2024. Occidental Mindoro followed with 4.9 percent share to the regional production. Meanwhile, Marinduque had the least share of 0.5 percent of the regional fish production. (Figure 1 and Table B)
Volume of fish production in the region up by 2.9 percent
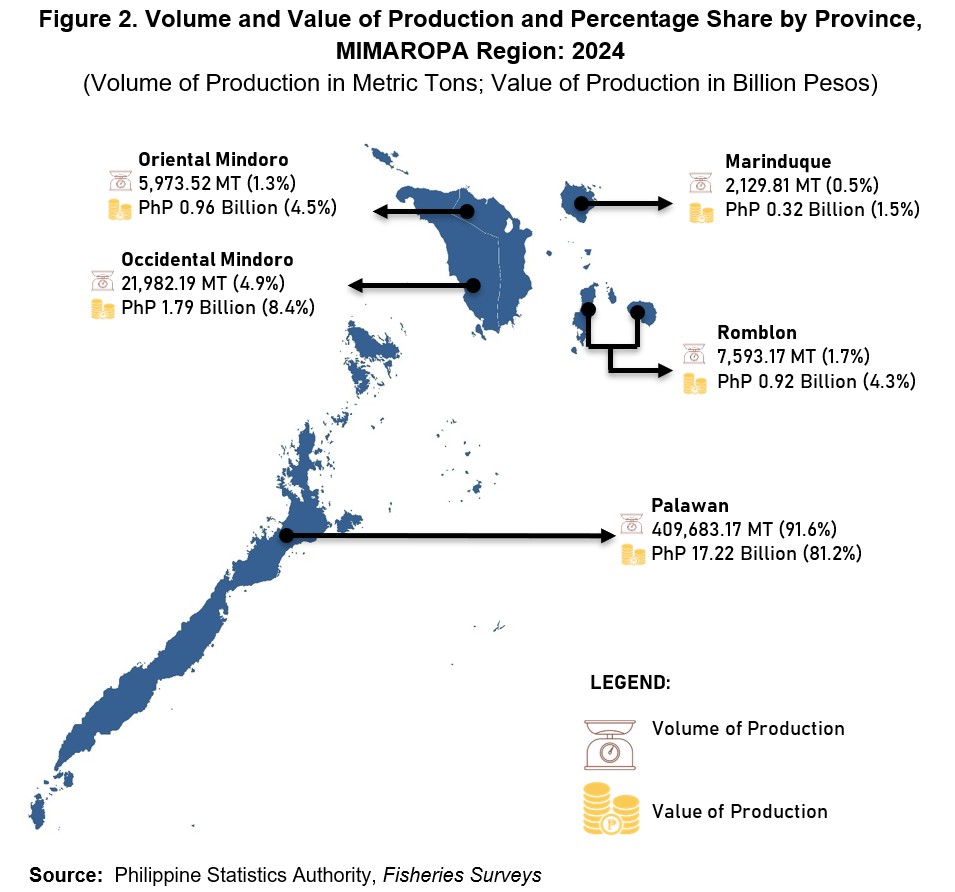
Total volume of fish production in the region of 447,361.86 metric tons in 2024 went up by 12,457.71 metric tons or 2.9 percent higher than 434,904.15 metric tons of fish produced in the previous year. The increment was mainly contributed by Palawan with an increase of 21,984.55 metric tons. (Figure 2 and Table B)
Value of fish production in the region down by 7.9 percent
In 2024, the regional total value of production amounted to PhP 21.22 billion. Palawan contributed PhP 17.22 billion or 81.2 percent on the total value of fish production in the MIMAROPA region. Occidental Mindoro followed with PhP 1.79 billion or 8.4 percent share to the regional production. (Figure 2 and Table C)
Relative to the estimated production in 2023, the regional total value of fisheries production decreased by 7.9 percent. Among provinces, Occidental Mindoro recorded the biggest decline of PhP 1.24 billion or 40.8 percent from PhP 3.03 billion in 2023 to PhP 1.79 billion in 2024. (Figure 2 and Table C)
Aquaculture fisheries posts 65.3 percent in the regional volume of production
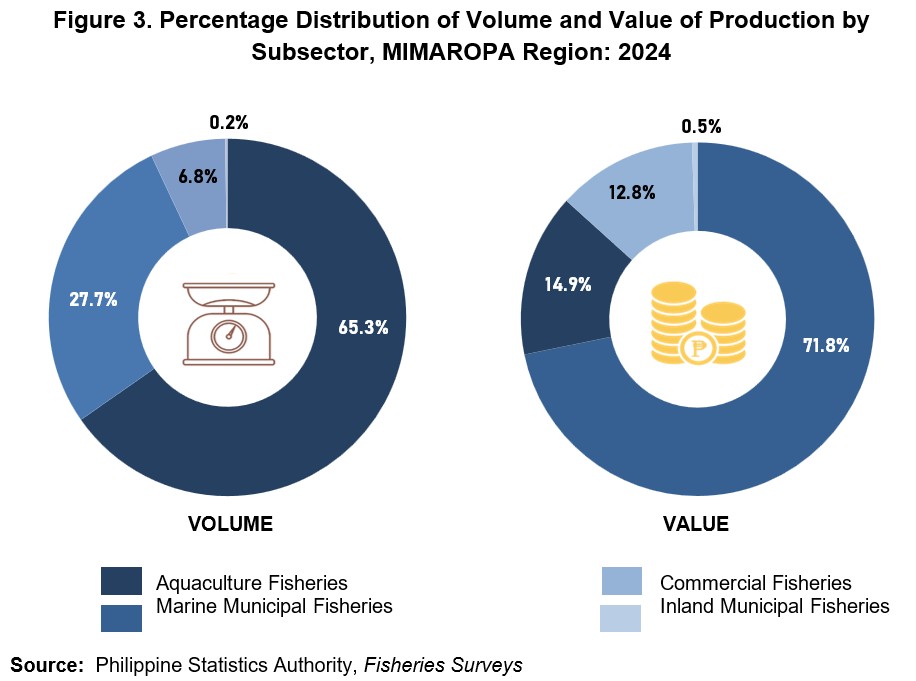
In terms of volume of production by subsector in the region, the aquaculture fishing constituted 292,170.87 metric tons or 65.3 percent of the region’s total fish production in 2024. Marine municipal fishing followed with 123,873.88 metric tons (27.7%), while commercial fishing and inland municipal fishing with 30,369.14 metric tons (6.8%) and 947.97 metric tons (0.2%), respectively. (Figure 3 and Table D)
Marine municipal fisheries accounts 71.8 percent share of the region’s value of production
Among fisheries subsectors, marine municipal fishing registered PhP 15.25 billion or an equivalent 71.8 percent share to the region’s total value of production in 2024. This was followed by aquaculture fishing which is valued at PhP 3.15 billion and had a 14.9 percent share to the regional total value of fisheries production. Meanwhile, commercial and inland municipal fishing recorded a share of PhP 2.72 billion (12.8%) and PhP 0.10 billion (0.5%), respectively. (Figure 3 and Table E)
Commercial fisheries’ volume of production up by 3.4 percent
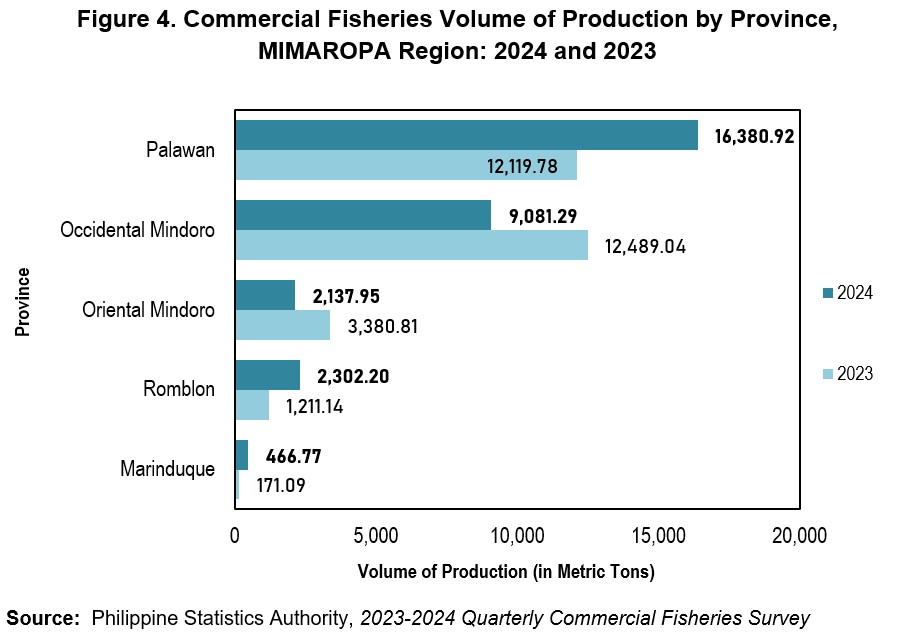
The volume of production in commercial fisheries increased by 997.28 metric tons or 3.4 percent from the estimated production of 29,371.86 metric tons in 2023 to 30,369.14 metric in 2024. The increment of production was due to the increase in production from Palawan with 4,261.14 metric tons (35.2% increase), Romblon with 1,091.06 metric tons (90.1% increase), and Marinduque with 295.68 metric tons (172.8% increase). (Figure 4 and Table F)
Marine municipal fisheries’ volume of production down by 10.5 percent
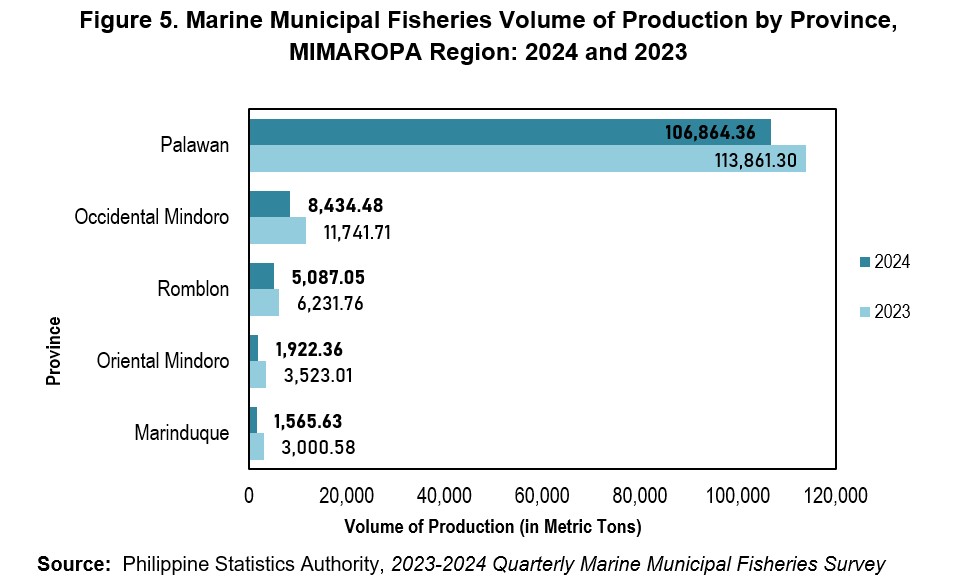
MIMAROPA region’s volume of production in marine municipal fisheries went down by 14,484.47 metric tons or 10.5 percent from the recorded 138,358.35 metric tons production in 2023 to 123,873.88 metric tons in 2024. The decrement was due to the cutback in production from all provinces in the region which was led by Palawan at 6,996.94 metric tons (6.1% decline) and followed by Occidental Mindoro at 3,307.23 metric tons (28.2% decline). (Figure 5 and Table G)
Inland fisheries’ volume of production down by 60.3 percent
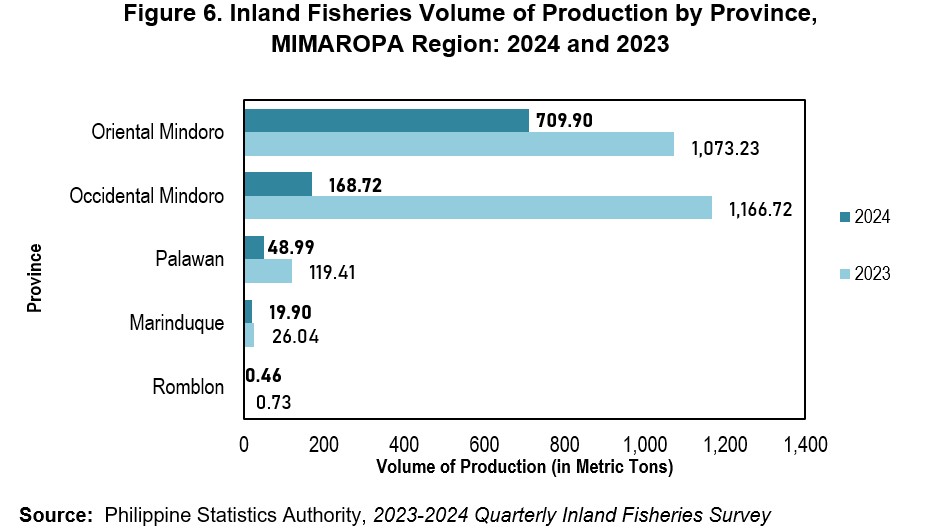
The regional production from inland fisheries experienced a decline by 1,438.16 metric tons or lower by 60.3 percent from 2,386.13 metric tons in 2023. The decline was prominent in Occidental Mindoro (998.00 metric tons, 85.5% decline) and Oriental Mindoro (363.33 metric tons, 34.0% decline). (Figure 6 and Table H)
Aquaculture fisheries’ volume of production up 10.3 percent
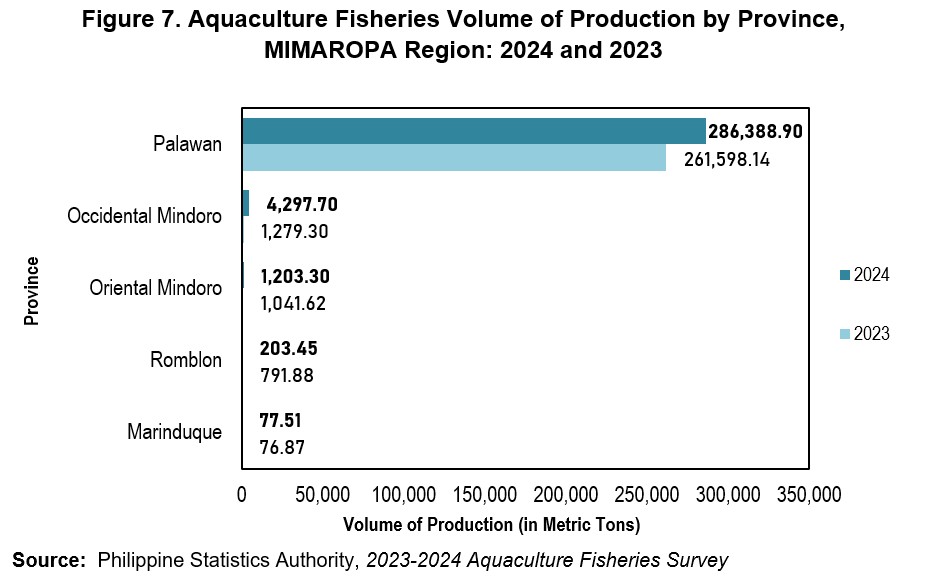
The total production of aquaculture fisheries in the region increased by 10.3 percent from 264,787.81 metric tons to 292,170.87 metric tons. The increase in production was led by Palawan at 24,790.76 metric tons (9.5% increase), Occidental Mindoro at 3,018.40 metric tons (235.9% increase), and Oriental Mindoro at 161.68 metric tons (15.5% increase), and Marinduque at 0.64 metric tons (0.8% increase). (Figure 7 and Table I)
(SGD) LENI R. RIOFLORIDO
Regional Director
MLLM / RRL / RVDL

