

Release Date :
Reference Number :
SR - 2025 - 075
Non-residential buildings had the highest number of constructions
In January 2025, there were 201 constructions based on the approved building permits in the province of Romblon. This represents a 230 percent increase over the 61 total number of constructions in January 2024. (Figure 1)
By type of construction, non-residential buildings had the most constructions, at 155 or 77.1 percent of total constructions for the month. It showed an extremely significant increase over the same month of 2024 with a total of 9 constructions. Most of the non-residential constructions were commercial buildings with 150 constructions (96.8%). (Figures 1 and 2)
Then, residential type of constructions was the second highest in terms of number of constructions, accounting for 36 or 17.9 percent of total construction in January 2025. This recorded an annual decrease of 30.8 percent from the same month of the previous year’s level of 52 constructions. The majority residential constructions were single-type houses, with a total of 35 (97.2%). (Figures 1 and 2)
Figure 1. Number of Constructions from Approved Building Permits by Type, Romblon: January 2025p
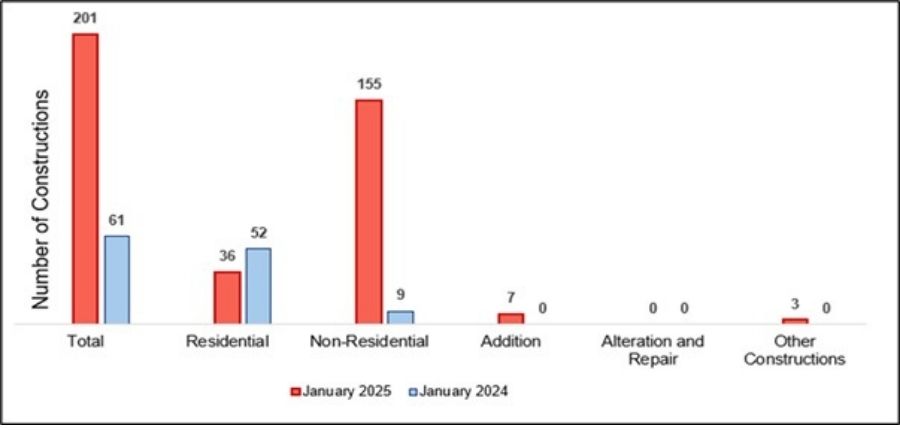
Source: Philippine Statistics Authority, January 2025 Construction Statistics from Approved Building Permits p
Figure 2. Number of Constructions from Approved Building Permits for
Residential and Non-residential, Romblon: January 2025p
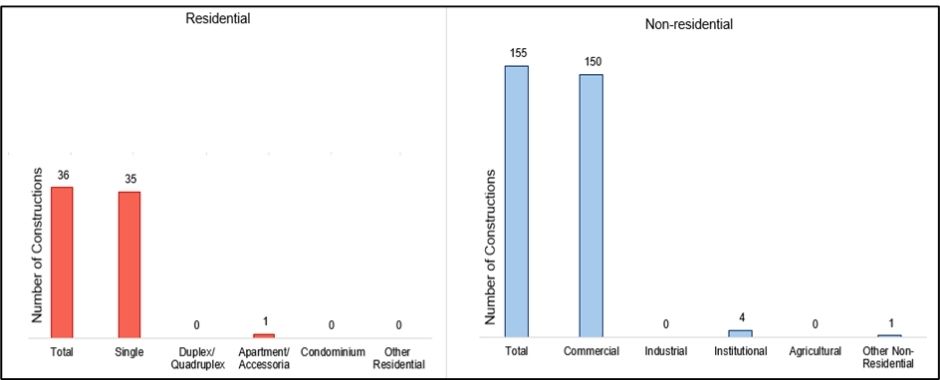
Source: Philippine Statistics Authority, January 2025 Construction Statistics from Approved Building Permits p
Addition, which refers to any new construction that increases the height or area of an existing building, and other constructions made up 3.5 percent, and 1.5 percent of all constructions, respectively. Meanwhile, there is no recorded construction under alteration and repair of existing structures. (Figure 1)
Non-residential buildings accounted for more than half of the total floor area of construction
In January 2025, the total floor area of all constructions in Romblon was 13,843 square meters. This excludes alteration and repair, other non-residential such as facade, helipad, niche, water tank, etc., and other constructions, which include demolition, street furniture, landscaping, and signboards, since there is no reported floor area for these types of constructions. The overall floor area in January 2025 had grown significantly from the 4,611 square meters that had been recorded during the same period the year before. (Figure 3)
Figure 3. Floor Area of Constructions from Approved Building Permits by Type,
Romblon: January 2025p
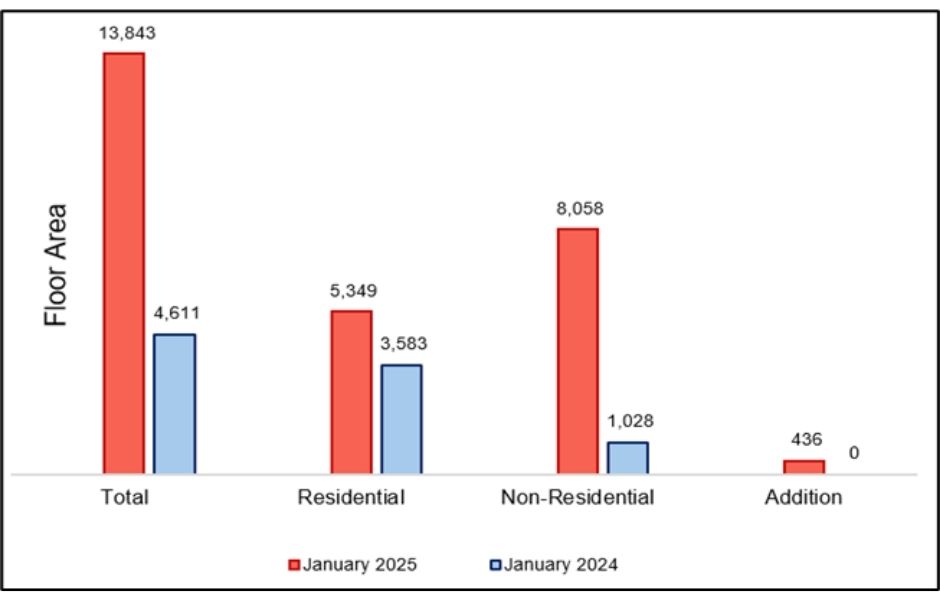
Source: Philippine Statistics Authority, January 2025 Construction Statistics from Approved Building Permits p
During the month, non-residential buildings represented 8,058 square meters, or 58.2 percent of all construction floor area. This represents an annual increase of about seven times over the 1,028 square meters of non-residential building floor area recorded in the same month of 2024. Under non-residential constructions, commercial building recorded the highest number of floor area with 5,300 square meters (65.8%).
Meanwhile, residential constructions accounted to 5,349 square meters or 38.6 percent of the total floor area of constructions in January 2025. It increased at an annual rate of 49.3 percent from the previous year’s same month floor area of 3,583 square meters. Single-type houses contributed the most with a total floor area of 4,773 square meters (89.2%). (Figures 3 and 4)
Figure 4. Floor Area of Constructions from Approved Building Permits for
Residential and Non-residential, Romblon: January 2025p
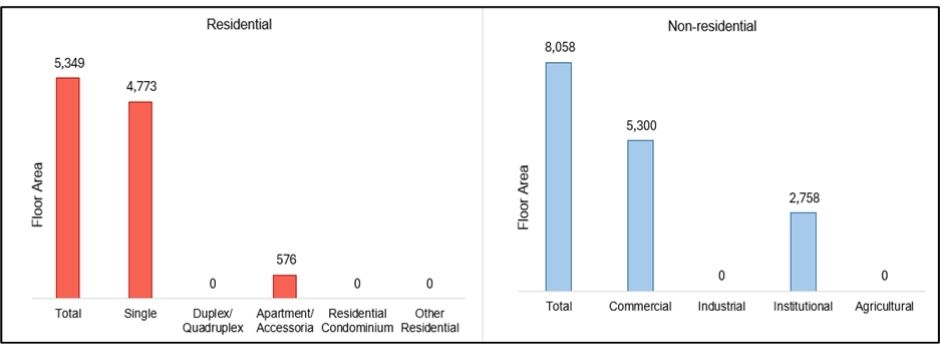
Source: Philippine Statistics Authority, January 2025 Construction Statistics from Approved Building Permits p
Residential buildings recorded the highest value of constructions
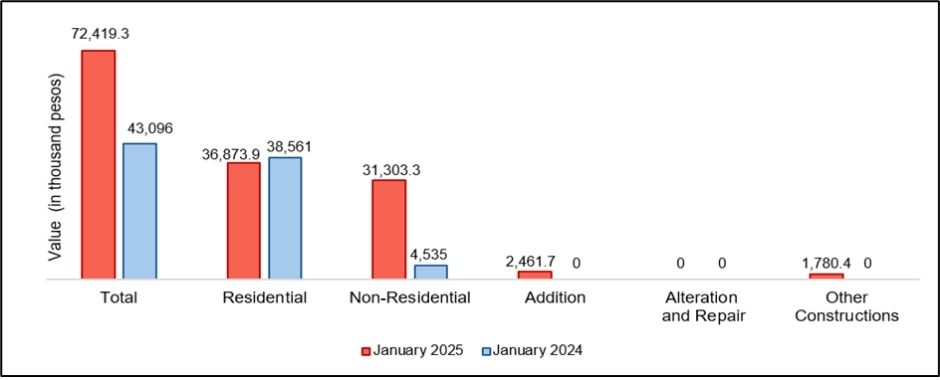
The total value of construction in January 2025 amounted to PhP 72.4 million, which is a 68.0 percent annual increase over the PhP 43.1 million value of constructions posted in the same month the year before. (Figure 5)
Figure 5. Value of Constructions from Approved Building Permits by Type,
Romblon: January 2025p
Source: Philippine Statistics Authority, January 2025 Construction Statistics from Approved Building Permits p
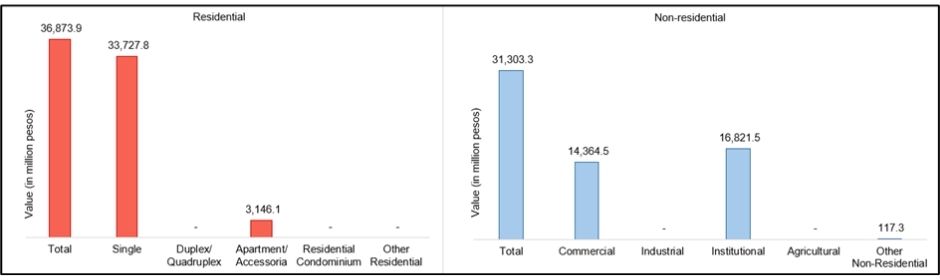
In January 2025, the construction value of residential buildings was PhP 36.9 million, or 50.9 percent of the total construction value. Compared to the PhP 38.6 million worth of residential building constructions reported in January 2024, this is a 4.4 percent annual decrease. At PhP 33.7 million (91.5%), single-type houses had the highest construction value among residential buildings.
At PhP 31.3 million, non-residential building constructions made up 43.23 percent of all constructions during that period. In the same month of 2024, the construction value of non-residential buildings was PhP 4.5 million, indicating an immense annual increase. The biggest value of non-residential structures, at PhP 16.8 million (53.7%), was found in institutional buildings. (Figures 5 and 6)
Figure 6. Value of Constructions from Approved Building Permits for
Residential and Non-residential, Romblon: January 2025p
Source: Philippine Statistics Authority, January 2025 Construction Statistics from Approved Building Permits p
(SGD) ENGR. JOHNNY F. SOLIS
Chief Statistical Specialist
Romblon Provincial Statistical Office
| Attachment | Size |
|---|---|
|
|
192.35 KB |
|
|
53.51 KB |