

Release Date :
Reference Number :
SR - 2025 - 077
Residential buildings accounted the highest number of constructions
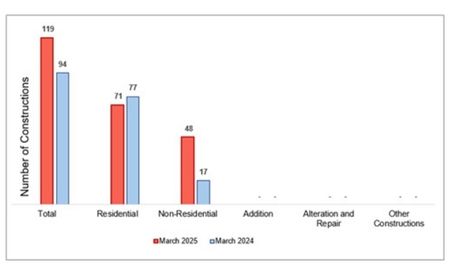
In March 2025, there were 119 constructions based on the approved building permits in the province of Romblon. This represents a 26.6 percent increase over the 94 total number of constructions in March 2024. (Figure 1)
By type of construction, residential buildings had the most constructions, at 71 or 59.7 percent of total constructions for the month. It showed an annual decrease of 7.8 percent over the same month of previous year with a total of 77 constructions. Most of the residential constructions were single-type houses with 67 constructions (94.4%). (Figures 1 and 2)
Then, non-residential type of constructions was the second highest in terms of number of constructions, accounting for 48 or 40.3 percent of total construction in March 2025. This recorded an annual increase of 182.4 percent from the same month of the previous year’s level of 17 constructions. The majority non-residential constructions were commercial buildings, with a total of 34 (70.8%). (Figures 1 and 2)
Figure 1. Number of Constructions from Approved Building Permits by Type, Romblon: March 2025p

Source: Philippine Statistics Authority, March 2025 Construction Statistics from Approved Building Permits p
Figure 2. Number of Constructions from Approved Building Permits for
Residential and Non-residential, Romblon: March 2025p
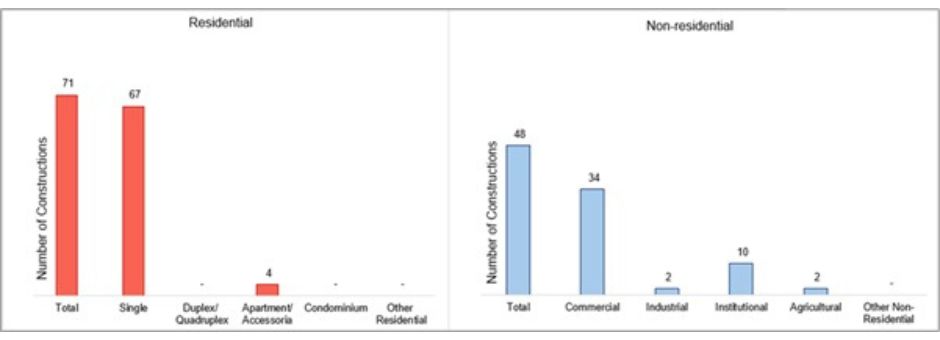
Source: Philippine Statistics Authority, March 2025 Construction Statistics from Approved Building Permits p
Meanwhile, there is no recorded construction under addition, which refers to any new construction that increases the height or area of an existing building, alteration and repair of existing structures and other constructions. (Figure 1)
Residential buildings recorded the largest floor area of construction
In March 2025, the total floor area of all constructions in Romblon was 12,710 square meters. This excludes alteration and repair, other non-residential such as facade, helipad, niche, water tank, etc., and other constructions, which include demolition, street furniture, landscaping, and signboards, since there is no reported floor area for these types of constructions. The overall floor area in March 2025 had grown 53 percent from the 8,308 square meters that had been recorded during the same period of 2024. (Figure 3)
Figure 3. Floor Area of Constructions from Approved Building Permits by Type,
Romblon: March 2025p
Source: Philippine Statistics Authority, March 2025 Construction Statistics from Approved Building Permits p
During the month, residential buildings represented 7,335 square meters, or 57.7 percent of all construction floor area. This represents an annual increase of 27.3 percent over the 5,762 square meters of residential building floor area recorded in the same month of 2024. Under residential constructions, single-type houses recorded the highest number of floor area with 6,869 square meters (93.6%).
Meanwhile, non-residential constructions accounted to 5,375 square meters or 42.3 percent of the total floor area of constructions in March 2025. It increased at an annual rate of 111.1 percent from the previous year’s same month floor area of 2,546 square meters. Commercial buildings contributed the most with a total floor area of 2,696 square meters (50.2%). (Figures 3 and 4)
Figure 4. Floor Area of Constructions from Approved Building Permits for
Residential and Non-residential, Romblon: March 2025p
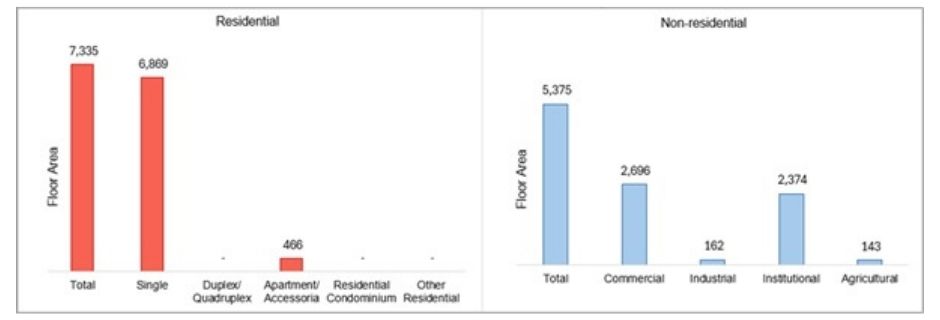
Source: Philippine Statistics Authority, March 2025 Construction Statistics from Approved Building Permits p
Non-residential buildings recorded the highest value of constructions
The total value of construction in March 2025 amounted to PhP 151.9 million, which is a 78.0 percent annual increase over the PhP 85.3 million value of constructions posted in March 2024. (Figure 5)
Figure 5. Value of Constructions from Approved Building Permits by Type,
Romblon: March 2025p
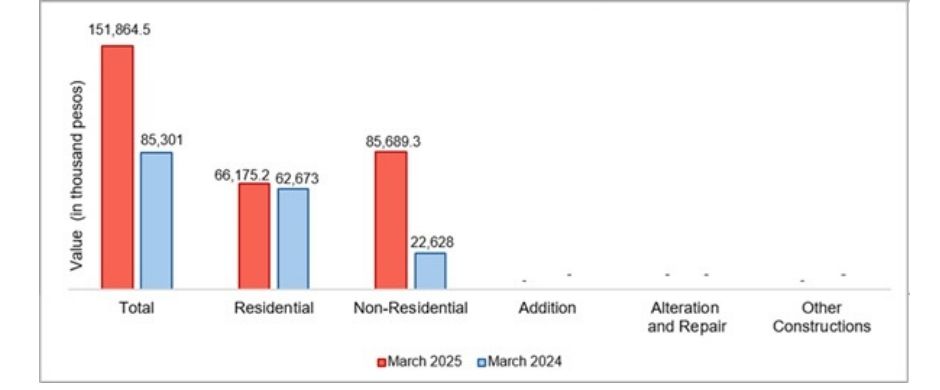
Source: Philippine Statistics Authority, March 2025 Construction Statistics from Approved Building Permits p
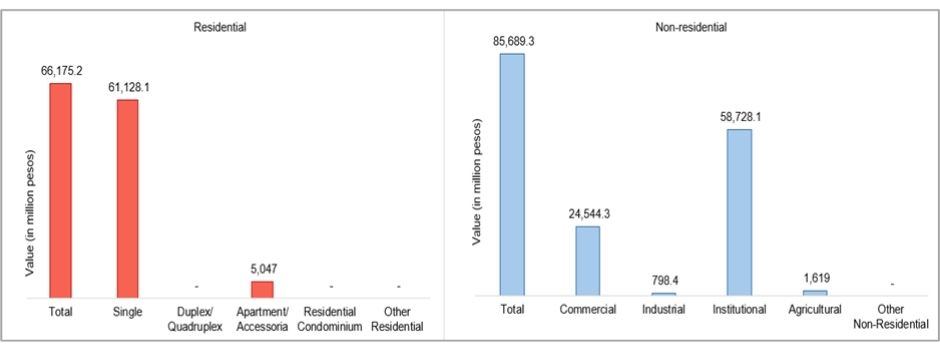
In March 2025, the construction value of non-residential buildings was PhP 85.7 million, or 56.4 percent of the total construction value. Compared to the PhP 22.6 million worth of residential building constructions reported in the same month last year, this is a 278.7 percent annual increase. At PhP 58.7 million (68.5%), institutional buildings had the highest value among non-residential constructions.
Then, with a total of PhP 66.2 million, residential building constructions made up 43.6 percent of all constructions during that period. In the same month of 2024, the construction value of residential buildings was PhP 62.7 million, indicating a 5.6 percent annual increase. The biggest value of residential constructions, at PhP 61.1 million (92.4%), was found in single-type houses. (Figures 5 and 6)
Figure 6. Value of Constructions from Approved Building Permits for
Residential and Non-residential, Romblon: March 2025p
Source: Philippine Statistics Authority, March 2025 Construction Statistics from Approved Building Permits p
(SGD) ENGR. JOHNNY F. SOLIS
Chief Statistical Specialist
Romblon Provincial Statistical Office
| Attachment | Size |
|---|---|
|
|
207.39 KB |