

Release Date :
Reference Number :
2024SR-028
Table A. Year-on-Year Inflation Rates: Philippines, MIMAROPA,
and Palawan
All Items, In Percent
(2018=100)
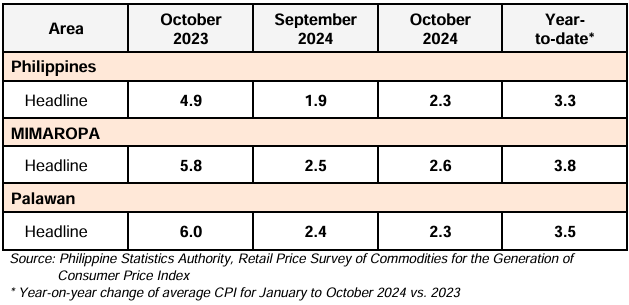
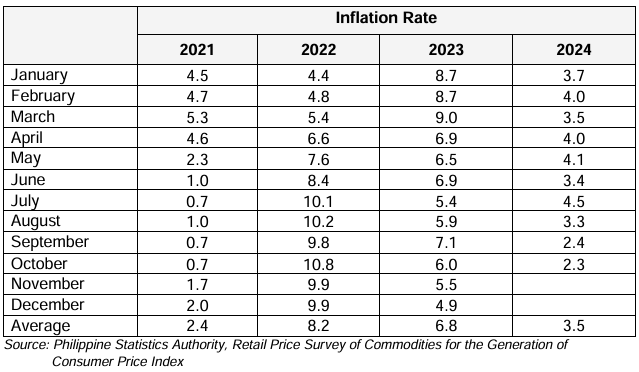
The headline inflation in the province of Palawan for October 2024 decreased to 2.3 percent from 2.4 percent in the previous month. In October 2023, the headline inflation was higher, at 6.0 percent. (Table A and Figure 1)
The downtrend in the overall inflation in the province was primarily influenced by the lower index for housing, water, electricity, gas, and other fuels, 7.1 percent from 7.7 percent, restaurants and accommodation services at 1.0 percent from 2.1 percent, and food and non-alcoholic beverages at 2.4 percent from 2.5 percent in the previous month.
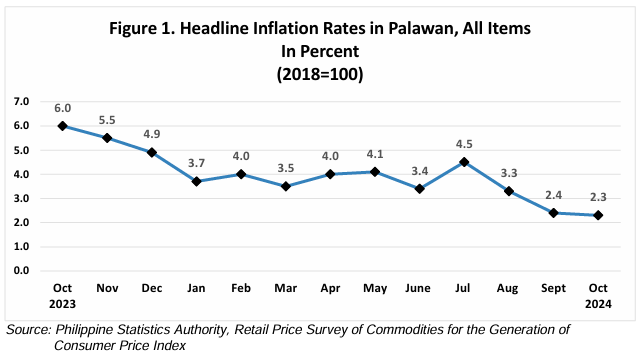
Table B. Year-on-Year Inflation Rates in Palawan,
All Items, In Percent
(2018=100)
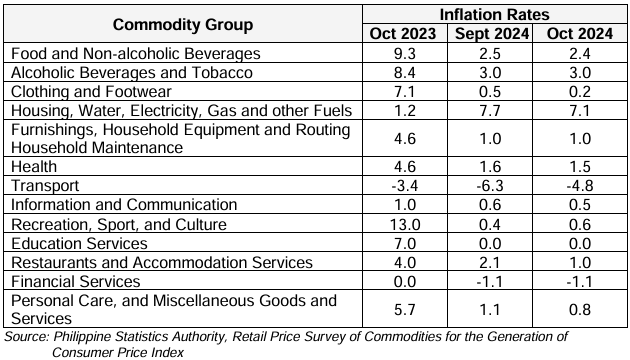
In addition, lower inflation rates were also observed in the following indices:
a. Clothing and Footwear, 0.2 percent, from 0.5 percent;
b. Health, 1.5 percent from 1.6 percent;
c. Information and Communication, 0.5 percent from 0.6 percent; and
d. Personal Care, and Miscellaneous Goods and Services, 0.8 percent from 1.1 percent.
On the other hand, two commodity groups exhibited higher inflation rates:
a. Transport, -4.8 percent from -6.3 percent; and
b. Recreation Sport and Culture, 0.6 percent from 0.4 percent.
The remaining commodity groups retained their previous month’s inflation rates.
Table C. Year-on-Year Inflation Rates in Palawan,
By Food Group In Percent
(2018=100)
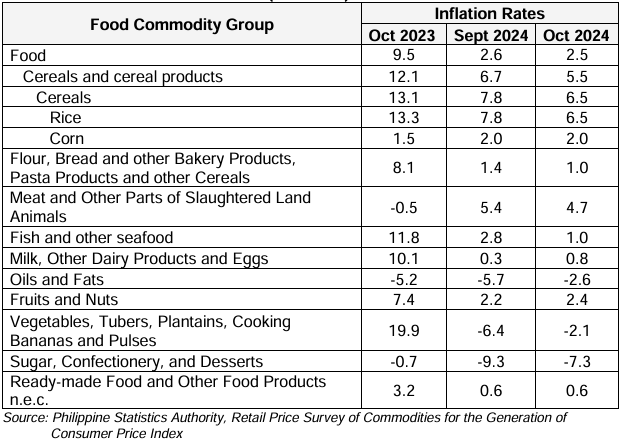
Food index in Palawan for October 2024 decreased to 2.5 percent inflation rate, from 2.6 percent in the previous month. In October 2023, the food index was higher at 9.5 percent inflation rate. (Table C)
The deceleration of the food inflation for the month was brought about by the lower index for rice at 6.5 percent from 7.8 percent, fish and other seafood, 1.0 percent from 2.8 percent, and meat and other parts of slaughtered land animals, 4.7 percent from 5.4 percent in the previous month.
Also contributing to the downtrend was flour, bread and other bakery products, pasta products and other Cereals at 1.0 percent from 1.4 percent in October 2023.
In contrast, higher inflation rates were observed in the following food groups:
a. Milk, Other Dairy Products and Eggs, 0.8 percent from 0.3 percent;
b. Oils and Fats, -2.6 percent inflation from -5.7 percent;
c. Fruits and Nuts, 2.4 percent from 2.2 percent;
d. Vegetables, Tubers, Plantains, Cooking Bananas and Pulses, -2.1 percent from -6.4 percent; and
e. Sugar, Confectionery, and Desserts, -7.3 percent from -9.3 percent.
The remaining commodity group retained their previous month’s inflation rates.
Table D. Year-on-Year Inflation Rates in Palawan,
All Items, In Percent
January 2021 – October 2024
(2018=100)
(SGD) DONNA MARIE D. MOBE
(Supervising Statistical Specialist)
Officer-in-Charge
Palawan Provincial Statistical Office
| Attachment | Size |
|---|---|
|
|
630.18 KB |